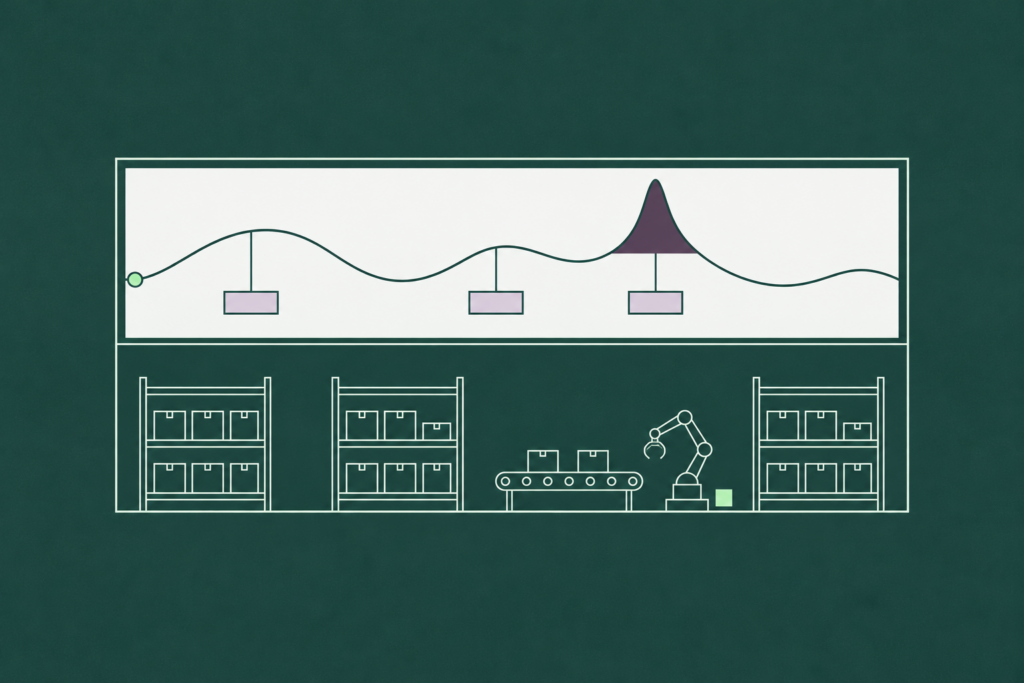
Inventory forecasting is the process of turning a demand forecast into stock decisions: how much of each item to hold at each location, when to reorder, and how much to order, so that the stock on hand covers demand over the lead time without sitting idle. Demand forecasting predicts what customers will buy. Inventory forecasting projects what that means for the shelf, week by week, and sets the rules that keep it stocked.
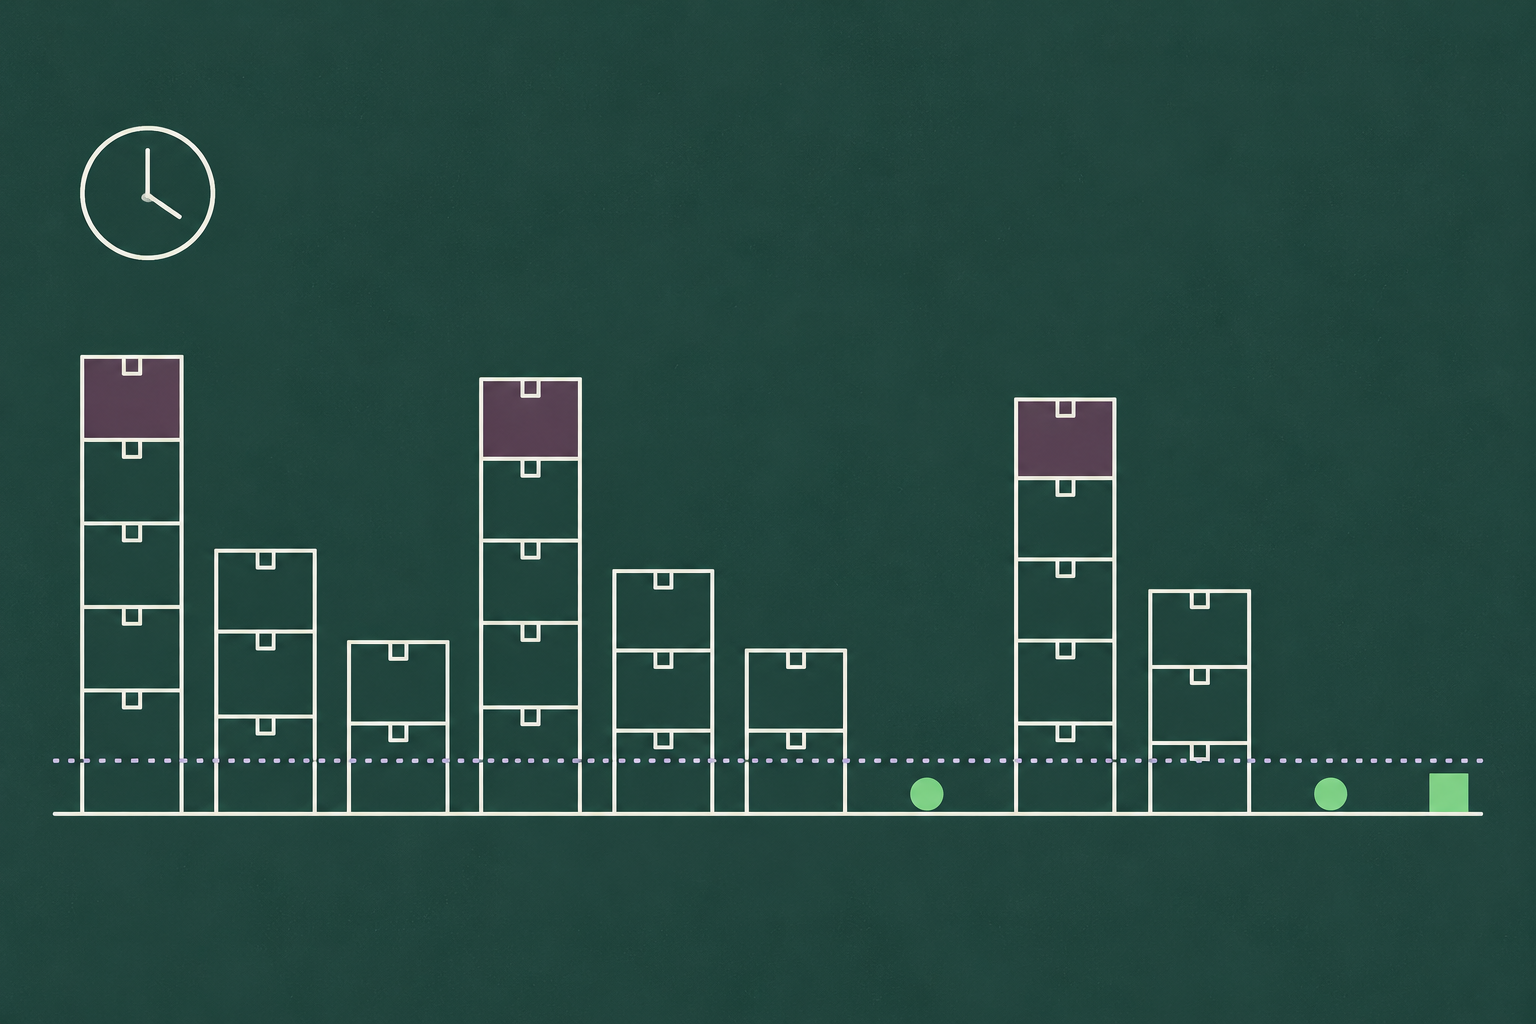
Most explanations stop at the definitions and a list of methods. We wanted to show the arithmetic, so this post builds one SKU over ten weeks, runs the same replenishment plan three times, and reads the results. With demand exactly as forecast, the plan is clean: stock cycles between 250 and 850 units and nothing runs out. With demand 20% above forecast, the same plan is 350 units short and the fill rate falls to 90.3%. With demand 20% below, stock rises 10% and nothing runs out. The asymmetry is the point. A reorder point rule absorbs an over-forecast cheaply, and it cannot protect against a sustained under-forecast, because safety stock is sized for random error and the miss in the second run is not random. It leans.
Inventory forecasting vs demand forecasting
People use the two as one phrase, and they answer different questions. Demand forecasting asks how many units customers will want, by SKU and location, in each future period. Inventory forecasting takes that number and asks what it means for stock: how much will be on hand at the end of each week, when the position will fall to the reorder level, how much to order, and how large a buffer is needed against the forecast being wrong.
Everything inventory forecasting produces (projected on hand, reorder point, order timing) is downstream of the demand forecast, and inherits its error. That is why the levers that inventory optimization pulls, from service levels to lead times, all move less than the forecast does. A better forecast changes every number in this post at once.
How to forecast inventory in five steps
- Forecast demand by SKU and location, at the period you replenish. Weekly, for most distributors and retailers. The forecast should come with an error estimate, because step 3 needs it.
- Measure lead time and its variability. The days from placing an order to the stock being available to sell, as a distribution rather than a single number. A supplier that averages 14 days and ranges from 9 to 23 needs a larger buffer than one that always delivers in 14.
- Size safety stock from forecast error and lead time. The buffer against demand running above forecast during the lead time. Our guide to the safety stock formula walks through six ways to calculate it on one example. The statistical version multiplies a service-level factor by the standard deviation of demand by the square root of lead time.
- Set the reorder point and the order quantity. The reorder point is the stock position that triggers an order, set from lead-time demand plus safety stock. The order quantity is how much to buy each time, usually from economic order quantity or a supplier minimum.
- Project on hand week by week and review. Roll the forecast forward against receipts and the rules from step 4, see when the position hits the reorder point, place the order, and check the projection against actuals every week.
Step 5 is the step most teams skip. The projection is where a wrong forecast becomes visible before it becomes a stockout.
Inventory forecasting formulas: projected on hand, lead-time demand and reorder point
Three formulas connect the forecast to the shelf. The numbers come from the worked example below: forecast demand 300 units a week, lead time 2 weeks, safety stock 250, order quantity 900, starting on hand 1,450.
Projected on hand = beginning on hand + receipts − forecast demand. In week 1: 1,450 + 0 − 300 = 1,150. The projection carries forward, and when an order is placed, it is added to the inventory position (on hand plus on order) even though it has not arrived.
Lead-time demand = average forecast demand × lead time. 300 × 2 = 600 units. This is how much will sell between placing an order and receiving it, so the stock position has to cover it.
Reorder point = lead-time demand + safety stock. 600 + 250 = 850 units. When the inventory position (on hand plus on order) falls to 850 or below at the weekly review, an order is placed. The safety stock is the part of the reorder point that covers demand running above 600 during the two weeks, and in this example it is sized to absorb random variation of about 36% around the weekly forecast at a 95% service level. Keep that figure in mind for the third run.

Worked example: one SKU over 10 weeks
Our plan: forecast 300 units a week, 1,450 on hand at the start, lead time two weeks, safety stock 250, order quantity 900, reorder point 850. Review is weekly. When the inventory position falls to 850 or below, order 900, which arrives two full weeks later. First run: demand comes in exactly as forecast.
| Week | Receipts | Demand | Ending on hand | Inventory position | Order placed |
| 1 | 0 | 300 | 1,150 | 1,150 | |
| 2 | 0 | 300 | 850 | 850 | 900 |
| 3 | 0 | 300 | 550 | 1,450 | |
| 4 | 0 | 300 | 250 | 1,150 | |
| 5 | 900 | 300 | 850 | 850 | 900 |
| 6 | 0 | 300 | 550 | 1,450 | |
| 7 | 0 | 300 | 250 | 1,150 | |
| 8 | 900 | 300 | 850 | 850 | 900 |
| 9 | 0 | 300 | 550 | 1,450 | |
| 10 | 0 | 300 | 250 | 1,150 |
Average ending on hand is 610 units, there are no stockouts, and stock bottoms out at exactly 250 each cycle, which is the safety stock doing nothing because nothing went wrong. The position hits 850 every third week, an order goes out, and the 900 units land the week the shelf would otherwise have dropped below the floor. A planner reading this table would be pleased with it, and that is the problem with reading it on its own. The plan works because demand did exactly what the forecast said.

What a 20% forecast miss does to the same plan
Second run: same plan, same rules, and demand runs 20% above forecast at 360 units a week.
| Week | Receipts | Demand | Sold | Short | Ending on hand | Order placed |
| 1 | 0 | 360 | 360 | 0 | 1,090 | |
| 2 | 0 | 360 | 360 | 0 | 730 | 900 |
| 3 | 0 | 360 | 360 | 0 | 370 | |
| 4 | 0 | 360 | 360 | 0 | 10 | |
| 5 | 900 | 360 | 360 | 0 | 550 | 900 |
| 6 | 0 | 360 | 360 | 0 | 190 | |
| 7 | 0 | 360 | 190 | 170 | 0 | |
| 8 | 900 | 360 | 360 | 0 | 540 | 900 |
| 9 | 0 | 360 | 360 | 0 | 180 | |
| 10 | 0 | 360 | 180 | 180 | 0 |
The plan is 350 units short of the 3,600 demanded, a fill rate of 90.3%, with stockouts in weeks 7 and 10, and average on hand falls from 610 to 366. Watch how it happens. The first cycle holds: stock dips to 10 units in week 4 and the delivery lands in week 5. Each cycle after that starts 60 units lower than the last, because the order quantity was sized for 300 a week and demand is 360, and by week 7 the shelf is empty before the next delivery. Nothing in the rules notices. The reorder point triggers on schedule, the orders go out on schedule, and the position keeps sliding.
Third run: demand 20% below forecast, at 240 a week. Average on hand rises from 610 to 670, about 10% more stock, with no stockouts, and the position still sits at 850 at the end of week 10 with another 900 on the way. The cost is carrying cost on the extra units and a slower turn. The cost of the second run is lost sales and the customers who went elsewhere.

The example was built to show one lesson. The 250 units of safety stock in this plan would absorb weekly demand swinging roughly 36% in either direction, provided the swings cancel. The second run never swings. It misses by 20% in the same direction every week, and a buffer sized for noise has no answer for a lean. That lean has a name, forecast bias, and it is the first thing to check when a plan that looks fine in the base case keeps running out, before the safety stock and before the lead time: has the forecast been low for three months running?

Inventory forecasting methods by item type
Whatever feeds step 1 should fit the item, and a catalog usually needs several methods at once.
| Item type | What the demand looks like | Method that fits | Where it is explained |
| Stable items | A steady level with random noise | Exponential smoothing; a moving average is the floor to beat | Time series methods |
| Seasonal items | A repeating annual shape with a trend | Holt-Winters or seasonal ML, with two or more years of history | Holt-Winters and other time series methods |
| Intermittent items | Zero most weeks, a few units occasionally | Croston’s method or SBA, with service level as the KPI | Croston’s method for intermittent demand |
| New items | No history | Analog forecasting from similar launches, replaced by actuals after 8 to 12 weeks | Forecasting a new product |
| Promoted items | A baseline with spikes on the promotion calendar and dips after | Driver-based machine learning with the calendar and price as inputs | What the promotion calendar does to error |
One line of guidance on reading it. Each method produces an error estimate as well as a forecast, and the error estimate is what step 3 turns into safety stock, so the method choice sets the buffer as well as the number. A method that forecasts a promoted item without the calendar will report a large, apparently random error, and the safety stock built from it will be large and mostly idle.
Inventory forecasting software: what to look for
The third run is the case to evaluate any inventory forecasting software against, because the base case flatters everything. Five capabilities decide whether a tool would have caught it.
- Forecasts at SKU and location, at the period you replenish. Chain-level or monthly forecasts have to be split down, and the split adds error at the level where orders are placed.
- Forecast error measured per SKU and fed into safety stock automatically. When the error estimate changes, the reorder point should move with it. If the buffer is a parameter someone typed into the ERP in 2023, the second run above is already happening somewhere in the catalog.
- Promotions and price changes as model inputs. Planners adding an uplift by hand is the method the time series test found worth nine points of error.
- A method for items with no history. Otherwise every launch is a manual forecast and a guess at the buffer.
- A benchmark against the forecast you run today. On your SKUs, at the lag you order at, before any commitment.
DemandForecast.ai is built around the first two of those in particular. It produces a forecast and an error estimate for every SKU-location series, tracks bias as a signed figure so a lean like the one in the second run shows up as a drift alarm in the weeks it starts rather than as a stockout in week 7, and carries the promotion calendar, price and seasonality as inputs so the error estimate is honest about what the model can and cannot see. In the 2026 Demand Forecasting Accuracy Report, that forecast was benchmarked against the incumbent in 15 deployments and produced less error in every one, with error down 32% on average, and because safety stock scales with error, that reduction flows through to the buffer at the same service level.
If you would like to see the projection run on your own SKUs, with the bias check built in, request a demo and bring a product that keeps running out.