Integrated business planning (IBP) is a monthly management process that aligns demand, supply, inventory, product portfolio and financial plans into one set of numbers the executive team commits to, usually across a 24 to 36 month horizon. It grew out of sales and operations planning (S&OP), keeps S&OP’s monthly cycle and demand-first sequence, and adds finance, portfolio decisions and strategy to the same meeting.
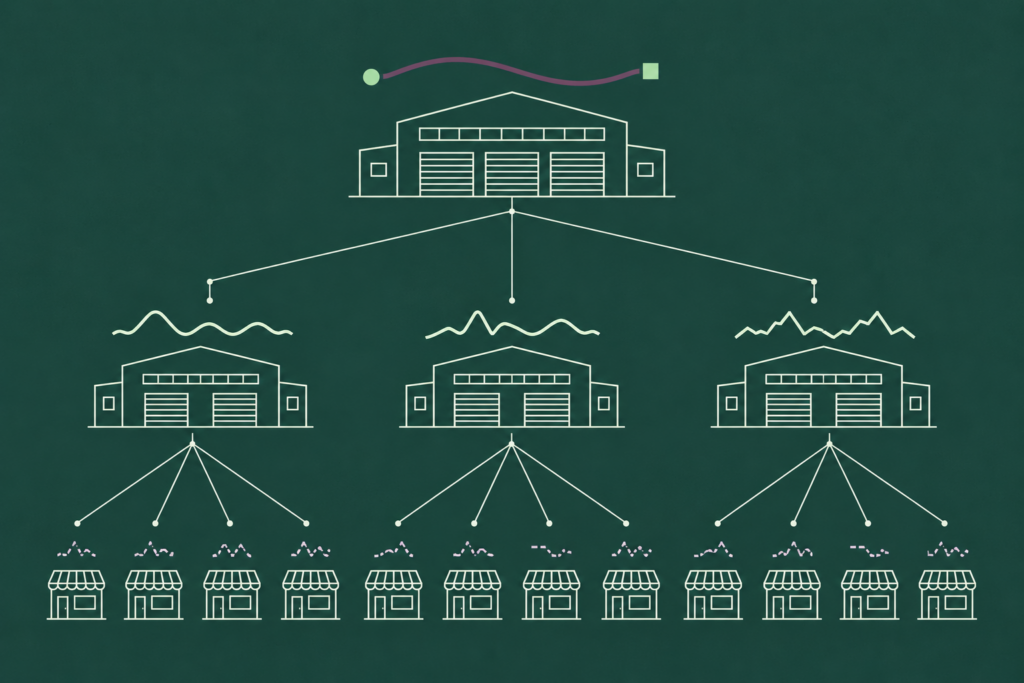
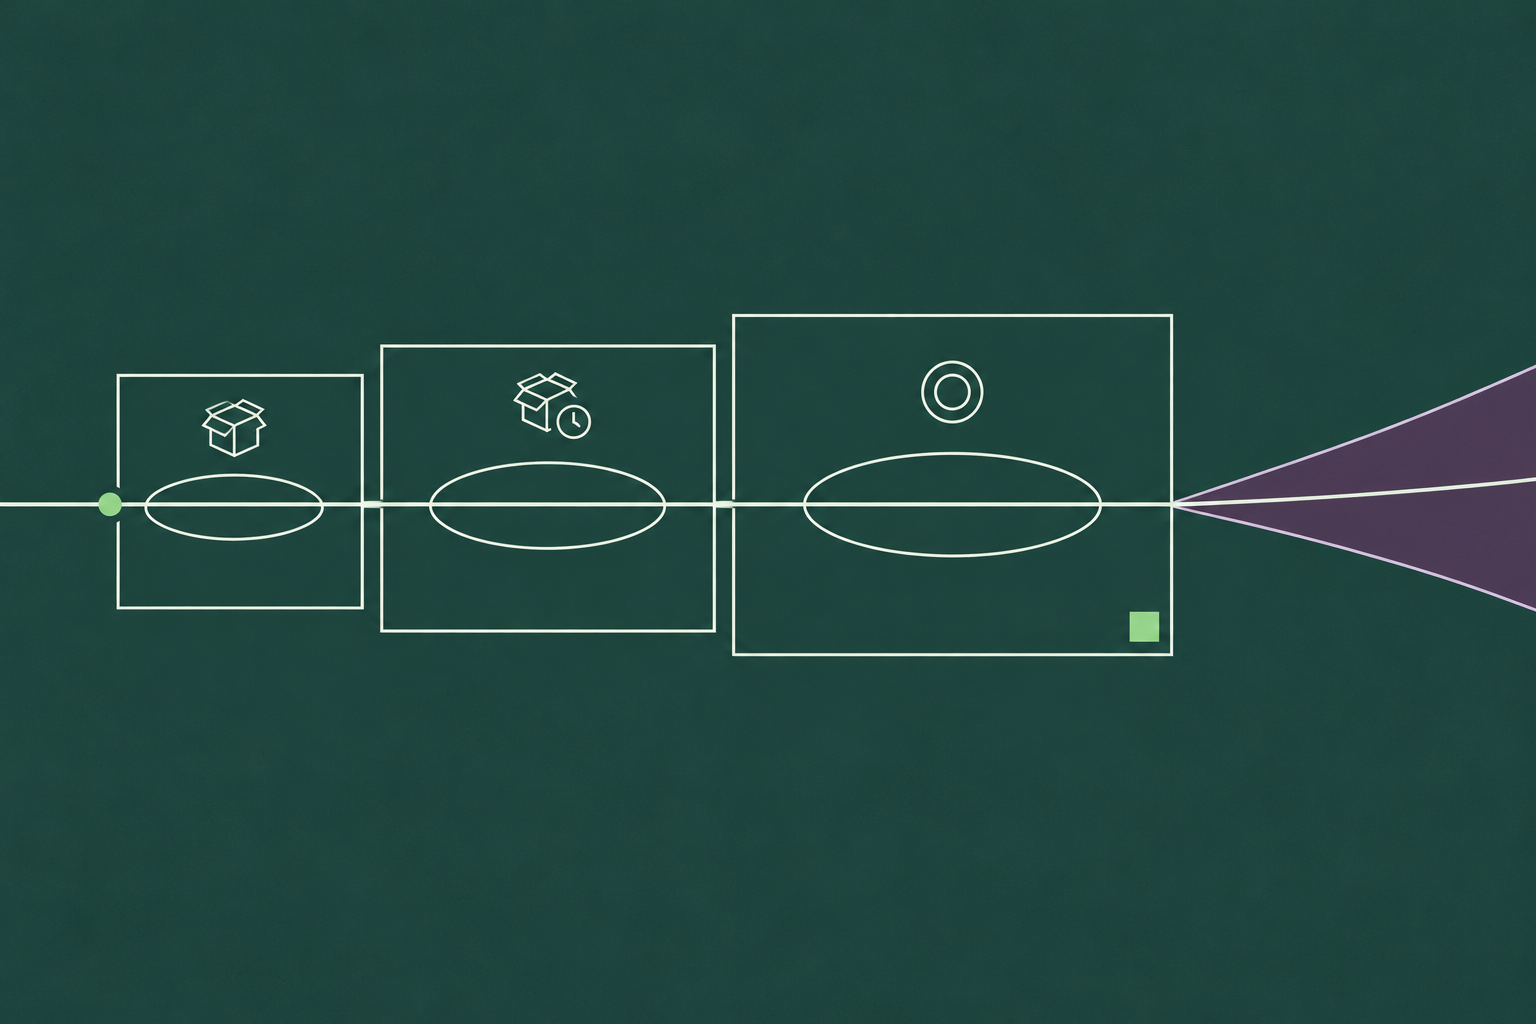
Most comparisons of the two stop at definitions and a table. We think the useful comparison is a decision. Below, one promotion request runs through S&OP, SIOP and IBP in turn, and the same request gets three different questions, three different owners and three different units of measure. What does not change is where each process starts. Every version begins with the demand review, and the number that leaves that review is the number every later step is built on. IBP widens the room and lengthens the horizon, and in doing so it commits money at the point where that number is least reliable. In our 2026 Accuracy Report, one distributor’s forecast accuracy ran from 58% to 73% one month out and 34% to 53% twelve months out. IBP’s financial decisions sit at the far end of that curve.
What is integrated business planning?
S&OP, which Oliver Wight originated in the early 1980s, is a monthly cycle that reconciles what the business expects to sell with what it can make and ship. Our guide walks through the S&OP process step by step: a baseline forecast, a demand review, a supply review, a pre-S&OP reconciliation and an executive meeting, across four weeks.
IBP keeps that skeleton and adds three things. A product and portfolio review at the front of the cycle, where launches, discontinuations and range changes are decided before demand is reviewed. A financial reconciliation in which units are translated into revenue, margin, cash and capital so the plan can be compared with the budget and the strategy. And executive ownership: the final meeting is chaired by the CEO or general manager and the outputs are commitments the leadership team is held to, which is why Oliver Wight describes IBP as advanced S&OP and why many companies with a mature S&OP process find they are already running most of it.
Horizon stretches with scope. S&OP is commonly described as covering around 3 to 18 months, and IBP as reaching 24 to 36 months, because capacity investment, portfolio and financial decisions need that long to act on.
S&OP vs IBP vs SIOP: the comparison table
Sales, inventory and operations planning (SIOP) sits between the two: S&OP with inventory promoted from a by-product of the plan to a decision in its own right.
| S&OP | SIOP | IBP | |
| Purpose | Balance demand and supply | Balance demand and supply at a chosen inventory position | Align demand, supply, portfolio and finance with strategy |
| Typical horizon (as commonly described) | 3 to 18 months | 3 to 18 months | 24 to 36 months |
| Unit of measure | Units and volume | Units, plus inventory days and service level | Units, revenue, margin, cash and capital |
| Owner | Supply chain or operations leader | Supply chain leader, with inventory targets agreed with finance | CEO or general manager, with finance as co-owner |
| Cadence | Monthly | Monthly | Monthly, with a quarterly strategic reset |
| Key inputs | Demand review, supply review | Demand review, supply review, inventory policy and inventory optimization targets | All of the above plus portfolio review, budget and financial reconciliation |
| Output | A consensus demand plan and a feasible supply plan | A consensus plan with inventory and service targets | One integrated plan with financial commitments and scenarios |
| Software category | Demand and supply planning tools | Planning tools with inventory optimization | Planning suites with financial modeling; often branded “IBP” |
In practice the line between the columns is blurrier than in a table. A company that runs S&OP with finance in the room, a 24 month horizon and the CEO chairing the executive meeting is doing IBP whether or not it uses the name, and plenty of “IBP” implementations are S&OP with a new logo on the deck. The test is the questions the meeting answers, which is what the next section is for.

One decision, three processes
A key retail customer asks for a six-week promotion in the second quarter. It will need 20% more volume on one of your top product lines, with the first shipments eight weeks out. The same request, as each process sees it:
| S&OP | SIOP | IBP | |
| Question asked | Can we supply 20% more units of this line for six weeks? | What does supplying it do to inventory and service across the network? | Should we do it, and what does it do to margin, cash and capacity for the year? |
| Owner | Operations, with sales presenting the request | Supply chain, with finance agreeing the inventory position | Executive team, with finance and commercial leading |
| Unit of measure | Units per week by SKU and plant | Units, plus weeks of cover, safety stock and fill rate on the line and its substitutes | Revenue uplift, gross margin after promotional discount, working capital tied up in the pre-build, and the capacity the pre-build takes from other lines |
| Horizon | The six promotion weeks plus the lead time to build ahead: about three months | The promotion, the pre-build before it and the post-promotion dip after it: about five months | The remainder of the year and the following year’s portfolio plan: 12 to 24 months |
| Output | Yes, with overtime in April and a pre-build starting week 4 | Yes, with 2.5 weeks of extra cover on the line and a markdown risk on the substitute SKUs | A decision: run it at a lower discount depth, or decline and offer the customer a Q3 slot when capacity is free, with the margin and cash case for each |
S&OP gives a feasibility answer, and it is a good one as far as it goes: the units can be made. The SIOP answer adds what making them costs in stock, including the part S&OP never sees, which is the post-promotion dip and the cannibalized substitutes sitting in the DC afterwards. The IBP answer is the one the CFO can sign, because it has been translated into margin and cash and compared with the alternative uses of the same capacity.
What all three share is the first number in the table. The 20% uplift, the dip after it and the cannibalization are forecast outputs, and they came out of the demand review before any of the three meetings sat down. If the true uplift is 12%, the S&OP overtime was unnecessary, the SIOP cover is 40% too high and the IBP margin case was built on volume that never arrived.

What IBP adds: finance, portfolio and strategy in the same cycle
Four additions turn an S&OP cycle into an IBP cycle, and each changes who speaks in the meeting.
Financial translation. Units become revenue, margin, cash and capital, so the plan can be compared with the budget every month and the gap explained. This is the addition that brings the CFO into the room as an owner.
Portfolio decisions. Launches, discontinuations and range changes are decided inside the cycle, in a product review that runs before the demand review, so the demand plan reflects the portfolio that will exist, and the new item forecasts arrive with the plan.
Scenario planning. Because the plan is financial, alternatives can be costed: the promotion at a lower discount, the capacity expansion a quarter later, the supplier switch. IBP meetings compare scenarios where S&OP meetings approve a plan.
Executive ownership. The outputs are commitments the leadership team is measured on, which is what gives the process authority over the functions that would otherwise plan separately.
All four additions are real, and they are also the reason IBP’s reach exceeds its grip. Each one extends the plan further into the future, and the further out the plan goes, the more of it rests on forecasts that have not yet had the chance to be wrong.
The forecast every version runs on
Every version of the process starts with the demand review, and the number that leaves it is a forecast. The quality of that number decays with horizon, steeply. In our 2026 Demand Forecasting Accuracy Report, an electrical components distributor with 7,500 stocked SKUs measured accuracy by product segment across its forecast horizons, and it ran from 58% to 73% one month out to 34% to 53% twelve months out. The deployments in the report planned across horizons from 8 weeks to 36 months, which is the range IBP plans across, and the twelve-month figure is the kind of number an IBP financial reconciliation is built on.
Two things follow for anyone running IBP. First, measure accuracy by horizon, one row per month out, which our guide explains how to do when you measure forecast accuracy by horizon rather than as one portfolio figure. A forecast that is 70% accurate at one month and 45% at twelve should produce a one-month plan with firm commitments and a twelve-month plan with ranges, and an IBP process that commits capital to a single twelve-month number has skipped the measurement. Second, watch the consensus number for a lean. A demand review that blends a statistical baseline with sales input and executive adjustment produces a number that tends to drift in one direction, usually upward, and our guide to why consensus forecasts lean covers how to see it with a tracking signal. In an S&OP cycle a lean costs inventory. In an IBP cycle it costs a capacity decision.
This is where IBP makes forecast quality a CFO problem, and where DemandForecast.ai sits in an IBP stack. It is the forecasting layer underneath the planning suite: a statistical baseline per SKU-location that uses the promotion calendar, price and the other drivers that move demand, with accuracy and bias reported by horizon and the drivers behind each number shown, so the demand review starts from a measured number and the financial reconciliation knows how much to trust at each month out. The incumbents it was benchmarked against in the report included S&OP consensus numbers, and it beat the incumbent forecast in every deployment, 15 of 15, with error down 32% on average.

IBP the process vs SAP IBP the software
Two things share the name. Integrated business planning is a management process, as described above, and a company can run it in spreadsheets. SAP IBP is a cloud planning application that SAP named after the process, covering sales and operations planning, demand, inventory, response and supply, and supply chain visibility in one product. Buying the software does not install the process, and running the process does not require the software. When a vendor or consultant says “IBP”, ask which of the two they mean, because the readiness questions below apply only to the first.
Are you ready to move from S&OP to IBP? A six-question check
Six yes-or-no questions. Fewer than four yeses means the move adds scope to a process that is not yet stable, and the better investment is in the S&OP cycle itself.
- Does the monthly S&OP cycle run on schedule, every month, with the same steps in the same weeks?
- Is forecast accuracy measured by horizon, with a figure for one month out and a figure for twelve?
- Is finance in the demand review, agreeing the number rather than receiving it afterwards?
- Does the business run on one agreed demand number, or do sales, supply and finance each keep their own?
- Are launches and discontinuations decided inside the cycle, in a product review that precedes the demand review?
- Does the executive team attend the final meeting and treat its outputs as commitments?
Question 2 is the one most companies miss, and it is the one that decides whether the financial reconciliation at the heart of IBP means anything.

Integrated business planning software: what to look for
Software for IBP is a planning suite that holds the demand, supply, inventory and financial plans in one model, runs scenarios across them, and gives the executive meeting one set of numbers. Four things to look for. A financial layer that translates units into margin and cash without a separate spreadsheet. Scenario comparison that is fast enough to use in the meeting itself. Accuracy and bias reported by horizon, on the screen where the demand number is approved. And a clear answer on where the forecast comes from, because a suite that holds the plan is rarely the thing that produces the best forecast for it.
That last point is where a dedicated forecasting layer sits underneath a planning suite. The suite owns the process and the reconciliation. The forecasting layer owns the number the process starts with, and feeds it in with its error by horizon. If you would like to see what that number looks like on your own SKUs, benchmarked against the consensus forecast your demand review produces today, request a demo and we will set it up.