Most demand models are built to track twenty variables, and in practice a handful of them do nearly all the work. The rest add noise, cost and fragility. We learned this from a deployment in which a planning team was confident that more than twenty variables drove its demand, and the model, tested against demand it hadn’t seen, found signal in four.
Demand drivers are the variables with a causal relationship to demand: the factors that, when they change, change what customers buy. That’s a narrower definition than the one most planning teams use, which is closer to “anything that correlates with sales,” and the gap between those two definitions is the subject of this piece. It’s also why the industry line that more data means better forecasts is, for most portfolios, backwards.
What demand drivers are, and what they are not
A driver causes demand to move. A correlation just moved at the same time.
Price is a driver: cut it and, all else equal, more units sell, through a mechanism anyone can explain. A retailer’s promotional calendar is a driver, because a feature and a display put the product in front of shoppers who wouldn’t otherwise have seen it. Both pass the test that matters: you could describe why the variable changes demand before looking at any data.
Ice cream sales and sunburn cream sales are correlated, and neither drives the other; temperature drives both. Web visits correlate with orders for most products, and for most products they’re a symptom of the same marketing spend that drove the orders. Feed either into a model and you get a variable that looks predictive in history and contributes nothing once the underlying cause is already in.
Among the types of demand forecasting, time series methods learn from the shape of history alone and causal methods add explanatory variables, so a demand driver is by definition a causal input; the main demand forecasting methods are covered in our complete guide. Every finding cited below comes from deployments benchmarked against the forecast the company already ran, and how the deployments were measured is documented at the top of our 2026 accuracy report.

The twenty variables most demand models track
A typical enterprise demand model, or the requirements document for one, lists inputs like these. Price and price changes. Promotions, by type and depth. Seasonality. Public holidays and school calendars. Weather, current and forecast. Competitor pricing and competitor promotions. Macro indices: consumer confidence, unemployment, inflation. Web traffic. Search volume. Social mentions and sentiment. Marketing spend by channel. Distribution, meaning store count or points of sale. Out-of-stock history. Product lifecycle stage. New launches and cannibalization. Pay cycles and month-end effects. Local events. Shelf placement and facings. Ratings and reviews. Supplier lead time.
That’s twenty, and most planning teams could add five more specific to their category. The list is presented without judgment because every item on it has, in some business, been a real driver. Weather drives demand for de-icer and for barbecue charcoal. Pay cycles drive demand in cash-heavy retail. Reviews drive demand for a new consumer electronics product and do almost nothing for a bag of flour. You’ll probably recognize your own project somewhere in that list, either as the team that spent two years building pipelines to feed all twenty, or as the team that put them in the RFP because everyone else does.
Why four of them usually do the work
Here is the pattern, and we’d rather you take the pattern than the number.
One consumer hardware company in our 2026 accuracy report began its project with more than twenty variables its team was confident drove demand. The model narrowed them to the four that carried predictive signal. Forecasting got more accurate and simpler at the same time: 80% forecast accuracy across SKUs and channels, from a company that had been running homegrown models in Python and Excel. Which four matters less than why it was four, because they were specific to that business, and anyone who copied them would be forecasting someone else’s demand.
The mechanism transfers. Many of the drivers a planning team tracks are correlated with each other, or with a demand history that already contains their effect, so they add noise rather than signal. Holidays, school calendars and the retailer’s promotional calendar move together; once one is in the model, the other two mostly repeat it. Web traffic, search volume and marketing spend are three views of one campaign. A history with three years of Decembers already knows about December. What looks like twenty independent explanations is usually five or six underlying causes, each showing up under several names.
The only reliable way to tell which names earn their place is to test each candidate against held-out demand: forecast a period the model hasn’t seen, with and without the variable, and keep it if the error falls. A model can run that test on every candidate, in every combination, across every SKU. A planner working from experience can only say which variables feel important, and those are usually the ones that mattered in a memorable year. What we found when we tested the drivers that way is the fifth section of the report, and it’s the finding we expect to be quoted most, because it contradicts what most planning teams believe about their own business.

Why the twenty-first variable makes the forecast worse
Adding a variable is never free, even when it’s harmless in principle, and there are two costs.
The statistical one first, in plain terms. A model has a fixed amount of history to learn from. Every variable you add is another relationship it has to estimate from that same history, and with enough variables the model finds patterns that exist only in the past. It learns the noise. On the years it trained on, the forecast looks excellent; on next quarter’s demand, it’s worse than a simpler model would have been, and worse in ways that are hard to diagnose because the model can always point to a variable that “explains” the miss. The forecasting textbook most practitioners learned from puts it bluntly: statistical significance does not indicate predictive value, and the fit measures that reward extra variables tend to select too many, which is why Hyndman and Athanasopoulos recommend choosing predictors on out-of-sample accuracy rather than on how well the model fits data it has already seen.
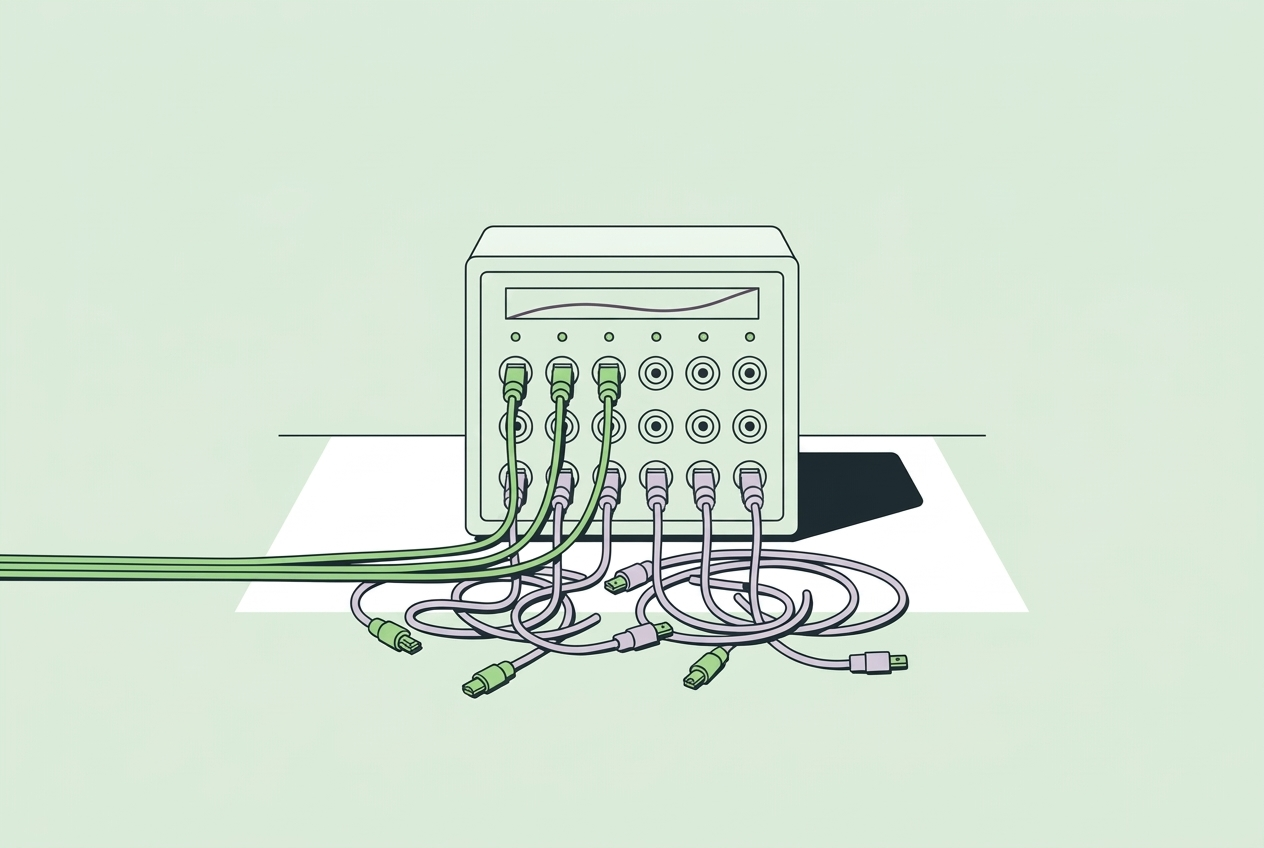
The operational cost is the one that gets teams in trouble. Every external variable is a data feed, and every feed is a pipeline someone owns, a contract someone renews, a schema that changes without warning, and a dependency that fails at the worst moment, which in demand planning is the week before peak season. A model built on four drivers has four things that can break. A model built on twenty has twenty, and when one goes stale the forecast degrades quietly rather than failing loudly, so nobody notices until the inventory does. Simpler models are also the ones still running in three years.

Drivers vs signals: a distinction worth keeping
Drivers explain. Signals detect.
A driver is a variable with a causal relationship to demand that you can plan against months ahead: price, promotion, distribution, the calendar. A signal is a near-term reading that says demand is already moving: yesterday’s point-of-sale data, this week’s open orders, next Tuesday’s weather. Signals rarely explain anything, and they don’t need to; their job is to catch a change before the planning cycle would.
Drivers go into the forecast that sets the plan. Signals go into the short-horizon layer that adjusts execution, which is the discipline of demand sensing and the signals behind it. Confusing the two is how teams end up with twenty variables: useful signals get promoted into the planning model, where they add little at a three-month horizon and break the pipelines described above.

How to find your own four
None of this is worth much as a provocation, so here is the procedure, which a planning team can run in a quarter without new software.
Start with the business explanation, not the data. For each candidate variable, write one sentence describing the mechanism by which it changes what customers buy. If nobody on the team can write that sentence, drop the variable before you test it. This step alone usually removes a third of the list.
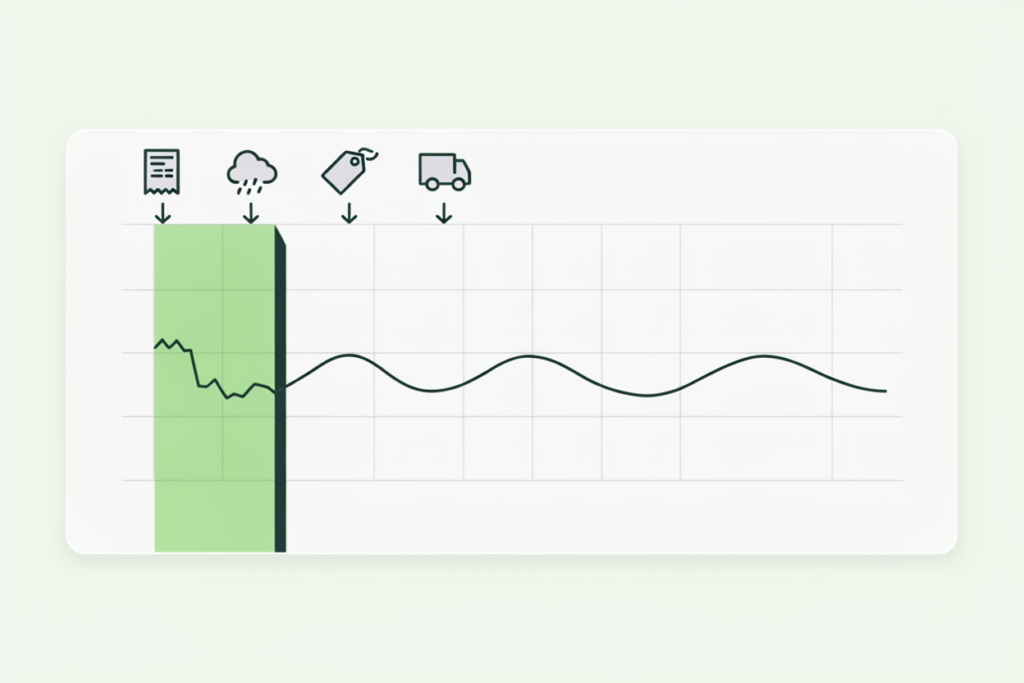
Test one variable at a time against a held-out period. Hold back the most recent six to twelve months of demand, fit the model on the rest with and without the candidate, and forecast the held-out months both ways. Score both at the level you plan at, in the metric you already report, and record the difference. It’s the same test you’d use to judge a planner’s overrides, and forecast value added is the right way to express it: each variable either adds value over the model without it or it doesn’t.
Keep what earns its place, and write down what didn’t and why. The record matters, because the sales director who was sure competitor pricing drove demand will ask again next year, and “we tested it in the second quarter and it added 0.2 points of error” ends that conversation. Retest annually or when the business changes, since a channel shift or a new competitor can promote a variable that added nothing last year.
Expect to end with a small number. Four in the case above; three to six is typical of what we see. If your process ends with fifteen, the held-out test was too generous, or the variables weren’t independent and you’re counting one cause several times.

What this means for AI demand forecasting
The conclusion people sometimes draw from this argument is that AI forecasting needs less data. That misreads it. The advantage of AI demand forecasting is that the model is better at working out which data matters, because it can run the held-out test on every candidate, in every combination, for every SKU, and keep only what earns its place. That’s the job planners were doing by hand, from memory, and mostly badly, and it’s why the consumer hardware team’s forecast got simpler and more accurate in the same project. Our overview of how AI and ML forecasting models work covers how the models learn those relationships.
The second consequence matters as much in practice. A forecast built on four drivers can be explained to the people who have to trust it. Four drivers fit on one slide. A sales leader can see the promotion, the price move and the distribution change that produced a number, and disagree with a specific input rather than with the model in general. That’s the difference between a forecast that gets adopted and one that gets overridden every month, and it’s the property we design for in DemandForecast.ai: every forecast comes with the drivers behind it and how much each one contributed, so the planning conversation is about the inputs rather than about whether to believe the output.
If you cite one finding from our report, cite this one. The methodology, the deployments and the full benchmark table are on the report page, and cite the report gives the reference in the form we’d ask you to use.