




Find the top forecasting solutions available today and learn about the pros and cons to help you make the most suitable decision for your business.
How we measured
Every number on this page is a measured outcome from a live deployment. Every accuracy figure comes from a head-to-head comparison against the forecast the company already relied on: statistical, consensus, or manual. Error is reported in each company's own metric and definition, so a MAPE reduction here means the same thing it means in that planner's monthly review. Nobody was surveyed.
The forecasting engine in all 15 deployments is Pecan's, the predictive engine behind DemandForecast.ai. Deployments ran between 2022 and 2026 across consumer health and wellness, food and consumer packaged goods, consumer hardware, fashion retail, grocery delivery, automotive aftermarket, high-tech, steel, and pool equipment manufacturing, distribution, and roadside assistance services. Limitations, including what we left out and why, are at the end of the page.
The five findings
- 14% to
56%
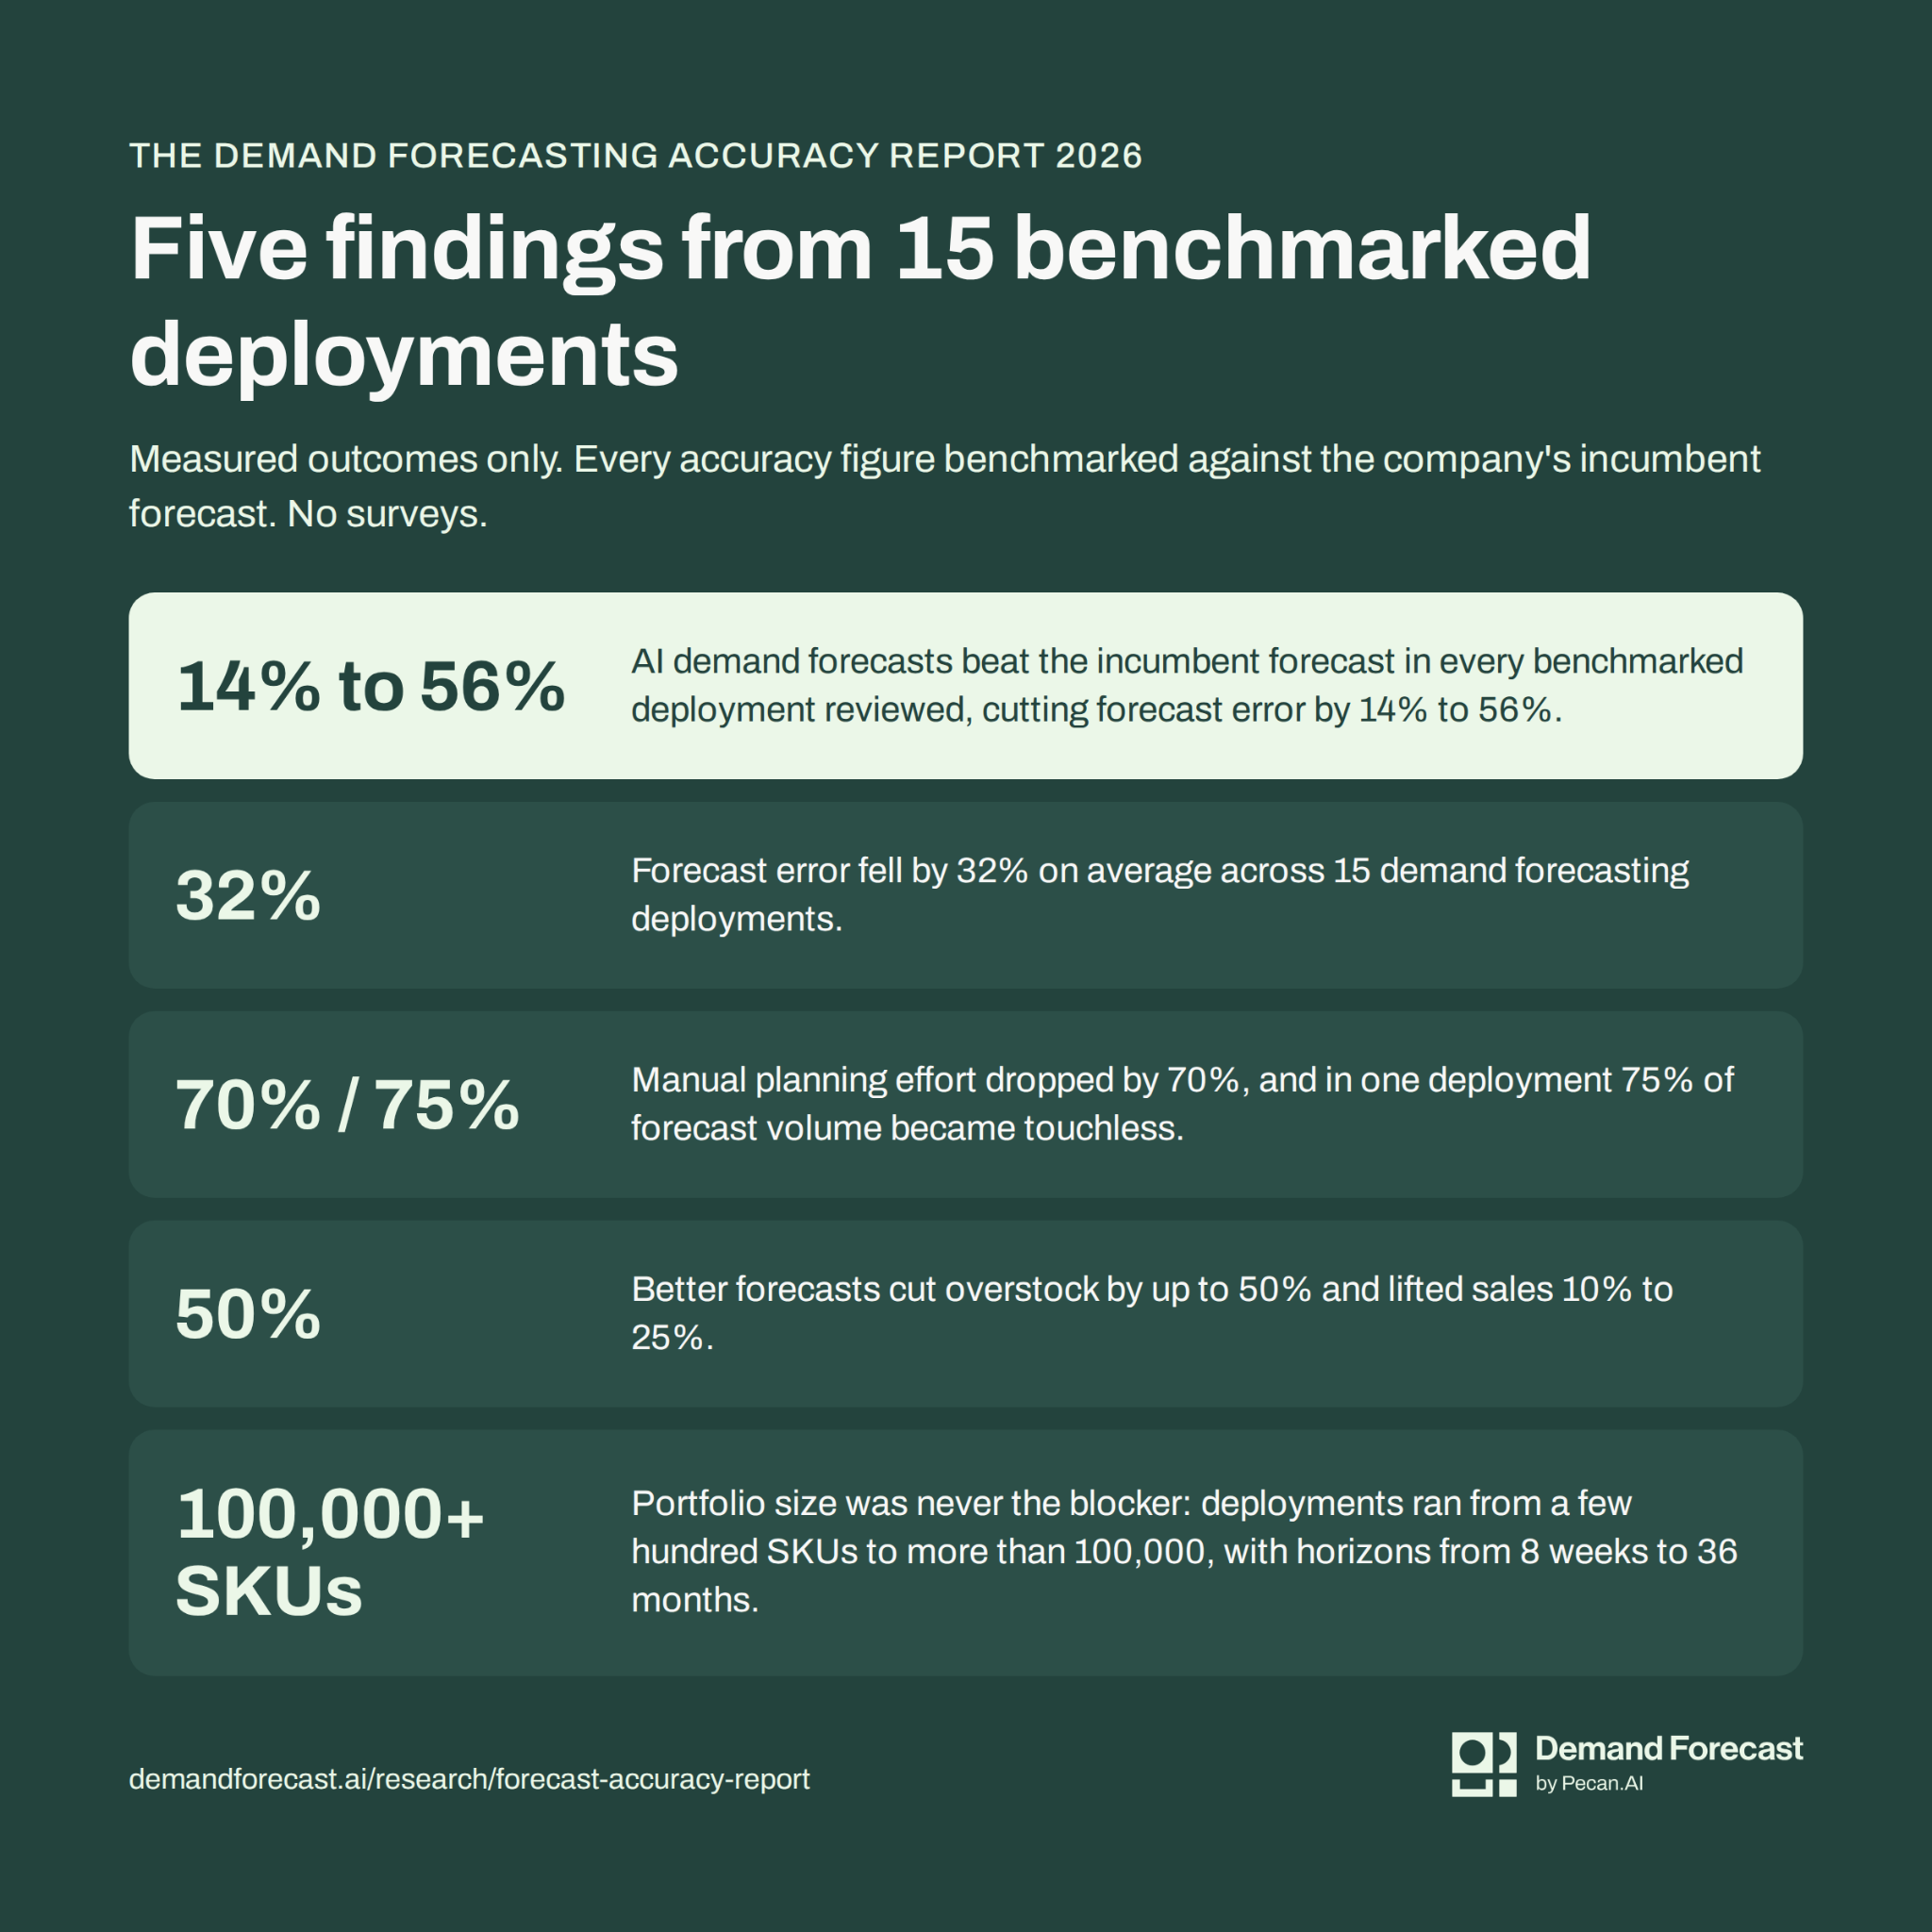
AI demand forecasts beat the incumbent forecast in every benchmarked deployment reviewed, cutting forecast error by 14% to 56%.
- 32%
Forecast error fell by 32% on average across 15 demand forecasting deployments.
- 70% / 75%
Manual planning effort dropped by 70%, and in one deployment 75% of forecast volume qualified as touchless.
- 50%
Better forecasts cut overstock by up to 50% and lifted sales 10% to 25%.
- 100,000+ SKUs
Portfolio size was never the blocker: deployments ran from a few hundred SKUs to more than 100,000, with horizons from 8 weeks to 36 months.
1. Accuracy against the incumbent forecast
Absolute accuracy figures travel badly. A 25% MAPEMAPE The unweighted mean absolute percentage error. It treats every item-period equally. is a strong result for a spare parts distributor with thousands of slow-moving items and a weak one for a beverage brand's top ten SKUs. Product mix, demand intermittency, and the level you forecast at (SKU, SKU-location, category) all move the number before the forecasting method has any influence on it. The benchmark that holds up is improvement over the forecast a company already runs, on that company's own data and in that company's own metric.
On that benchmark, the AI forecast won every comparison in the study. In each benchmarked deployment, the AI forecast produced less error than the incumbent, whether that incumbent was the baseline out of the ERP or planning system, a consensus number out of S&OP, or a planner's spreadsheet. One deployment ran the comparison month by month for a full year. Twelve months, twelve wins.
Twelve months, twelve wins.
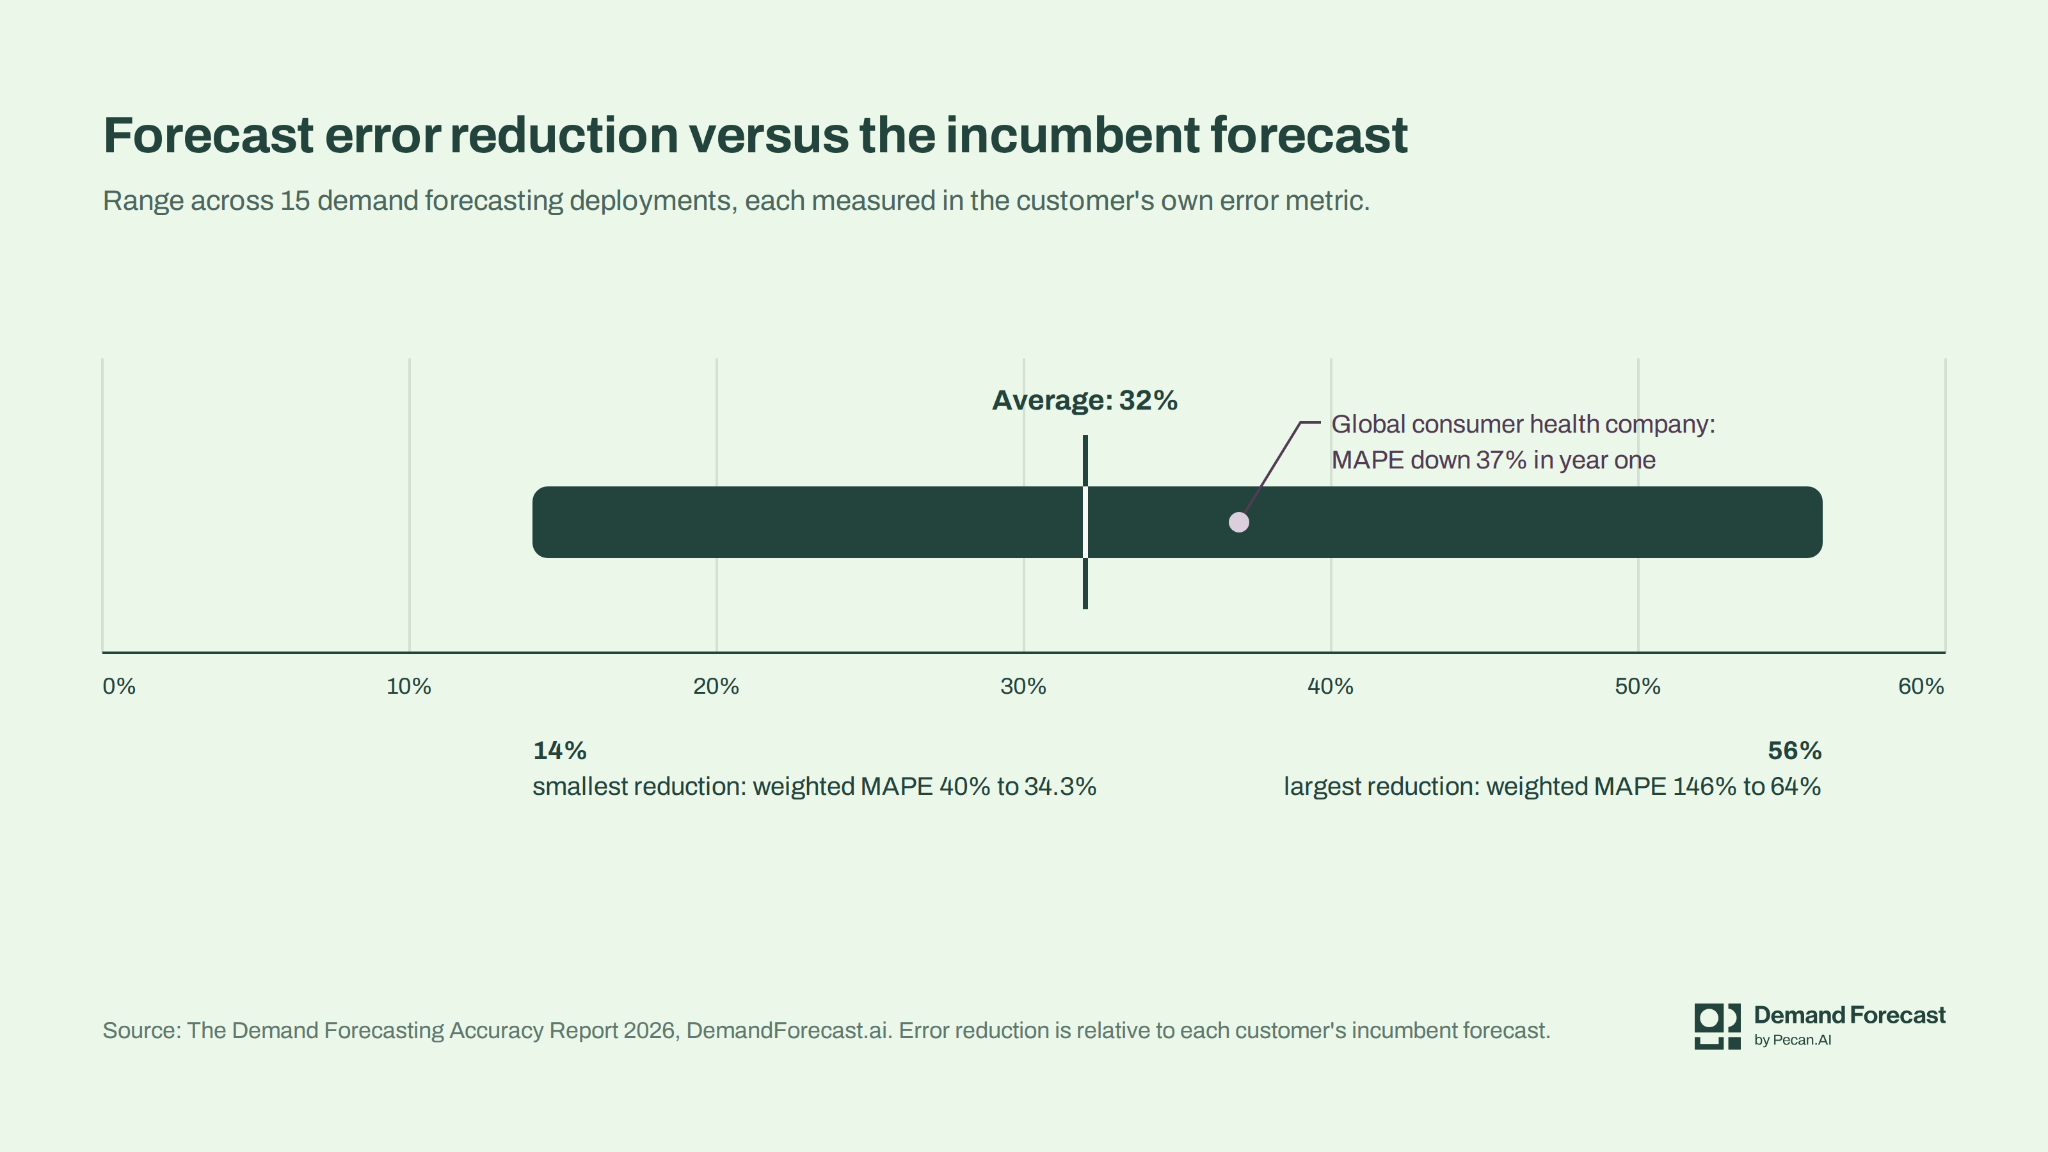
Error reduction ranged from 14% to 56%, with an average of 32% across the 15 deployments.
At the top of the range, 56% came from Rimports, a home fragrance distributor selling through Amazon and other channels, and the portfolio with the highest starting error in the set. Its manual forecasts had been producing both overstock and stockouts, and its Amazon rankings and storage costs were paying for it. Weighted MAPE fell from 146% to 64%. Weighted MAPE (WMAPEWMAPE Divides total absolute error by total actual demand across the portfolio, so high-volume items count for more than long-tail ones.) divides total absolute error by total actual demand across the portfolio, so high-volume items count for more than long-tail ones. A starting point above 100% means the incumbent's total absolute error was larger than the demand it was trying to predict, which is what intermittent, low-volume demand does to a forecast. At 64%, more than half the incumbent's error was gone, concentrated on the items that carry the volume.
The floor of the range belongs to the deployment that ran the month-by-month comparison. A health and wellness manufacturer's weighted MAPE went from 40% with its internal forecast to 34.3% with the AI forecast, a 14% reduction, and the AI forecast came in lower in every one of the twelve months across its most significant SKU segments. The smallest improvement in the study was also the most consistent one.
Between those two, Kenvue reduced MAPE by 37% in its first year, with models built on orders, shipments, and point-of-sale signals and a human-in-the-loop process that combines the AI's predictions with planner expertise. MAPE, the unweighted mean absolute percentage error, treats every item-period equally. A 37% cut on a large, established portfolio is a broad improvement, not a handful of outliers fixed.
Some companies measure against their own target rather than a textbook metric, and the benchmark works the same way. A pool equipment manufacturer had been forecasting from sales targets rather than demand signals, with an internal tool that produced recurring overstock and understock across SKUs. Measured against the company's own accuracy target, automated forecast accuracy went from 25% to 50%. The modeling effort went to the highest-revenue SKUs first, and the sales-led planning team was never asked to change how it worked.
“Pecan's Predictive GenAI framework is truly a game changer in making machine learning and AI capabilities accessible to the business team.”
2. What a better forecast is worth
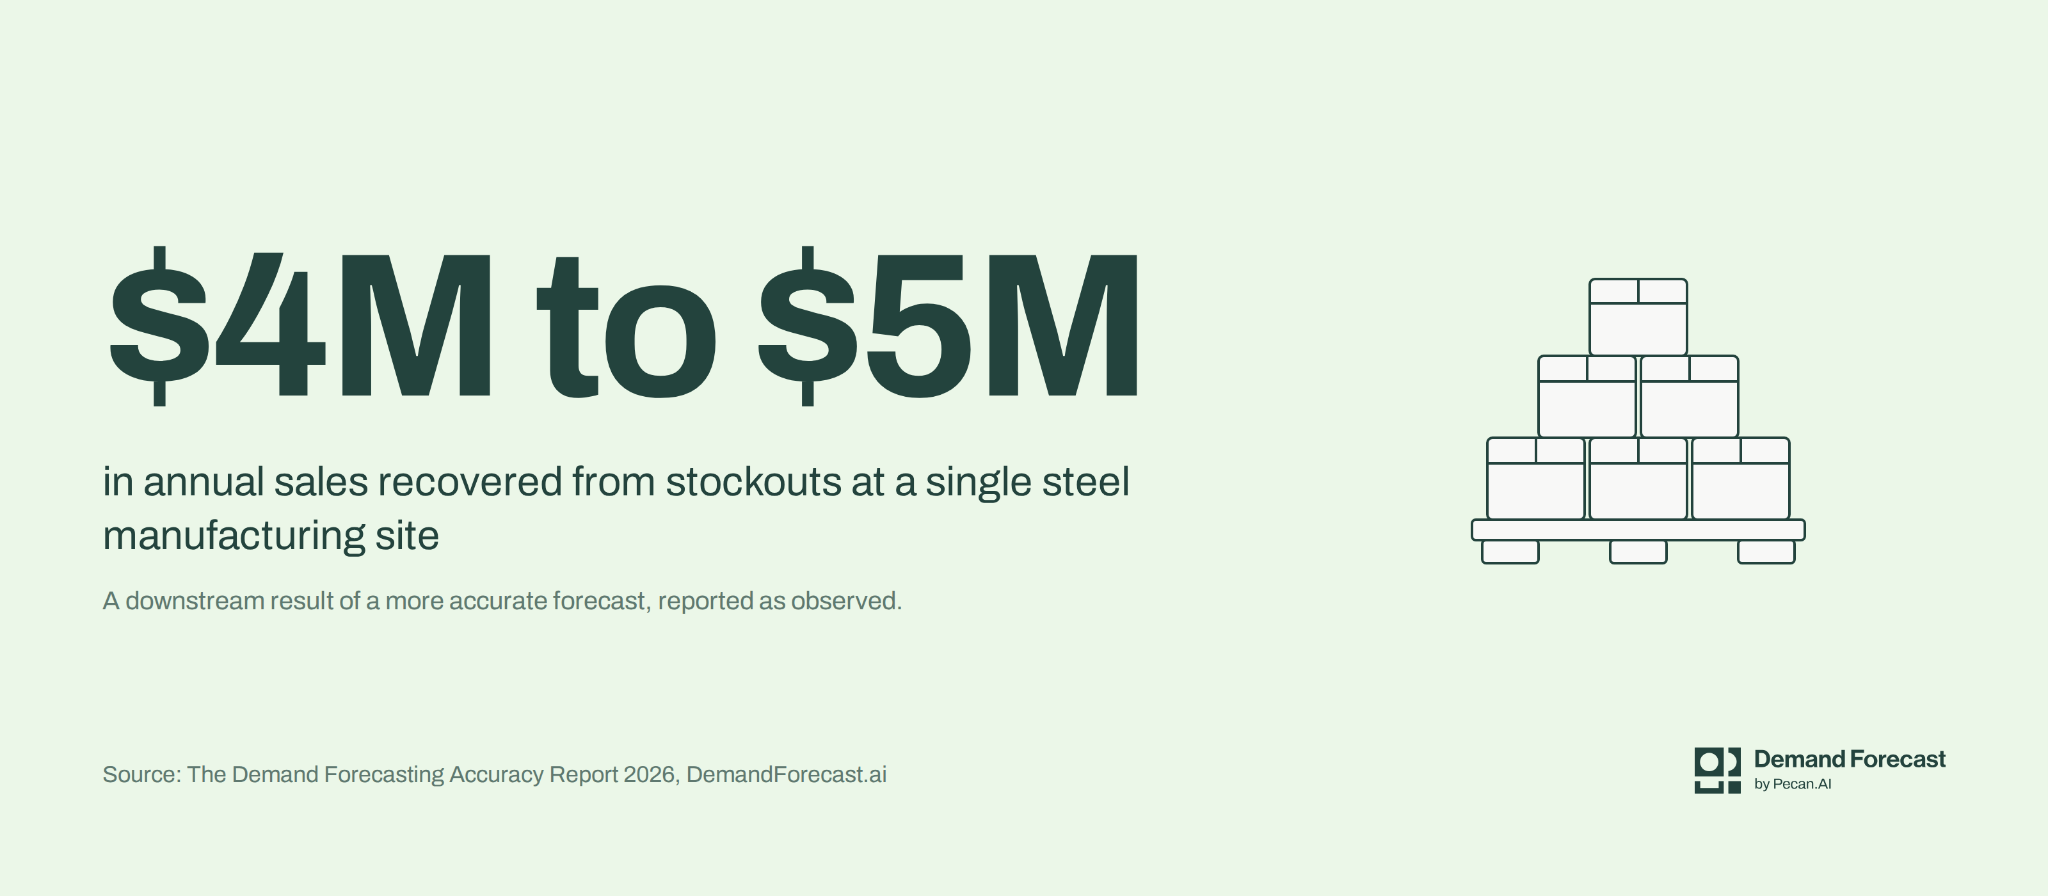
With that boundary in place, the downstream results were large. Better forecasts cut overstock by up to 50% and lifted sales by 10% to 25%. Both came from the same deployment, a global fast fashion retailer forecasting more than 10,000 SKUs across nearly 5,000 stores, and the sales lift came from fewer stockouts. That is the detail worth reading twice: the retailer had been overstocked and stocking out at the same time. It is the most common shape of forecast pain in the planning organizations we work with, and it starts in the forecast, well before the buying decision. A grocery delivery platform forecasting at SKU level across 26 cities saw the same pair move: overstock instances dropped by several orders of magnitude and stockouts fell to historical lows. Nucor recovered $4M to $5M in annual sales at a single site, revenue that had been lost to stockouts before the deployment, and sold about 300,000 additional pounds through improved planning decisions.
A Tier II high-tech component manufacturer reported 15% labor cost savings and inventory cost savings of over 25%, with forecast accuracy up from 50% to 80%, a confidence level on every SKU's forecast, optimized batch sizes, and a shorter effective supply lead time. Its first model was trained in under 14 days.
Two operations results from the wider study belong alongside these, because both applied the same forecasting logic further down the chain. A customer-facing delivery window narrowed from 14 days to 3, with about one day of error. Shipping costs fell 6% by predicting repeat orders and bundling shipments.
-
14 to 3 days
customer delivery window, about one day of error
-
6%
lower shipping costs from predicting repeat orders
3. Planner effort and the touchless threshold
Forecast accuracy gets the headlines. Planner time is where most teams feel the change first.
Most planning teams know the shape of the problem before anyone measures it. The planning tool produces a baseline. The planners don't trust it, so they adjust it, SKU by SKU. Next month brings the same adjustments to the same SKUs. The manual work never shrinks, because the forecast underneath it never improves.
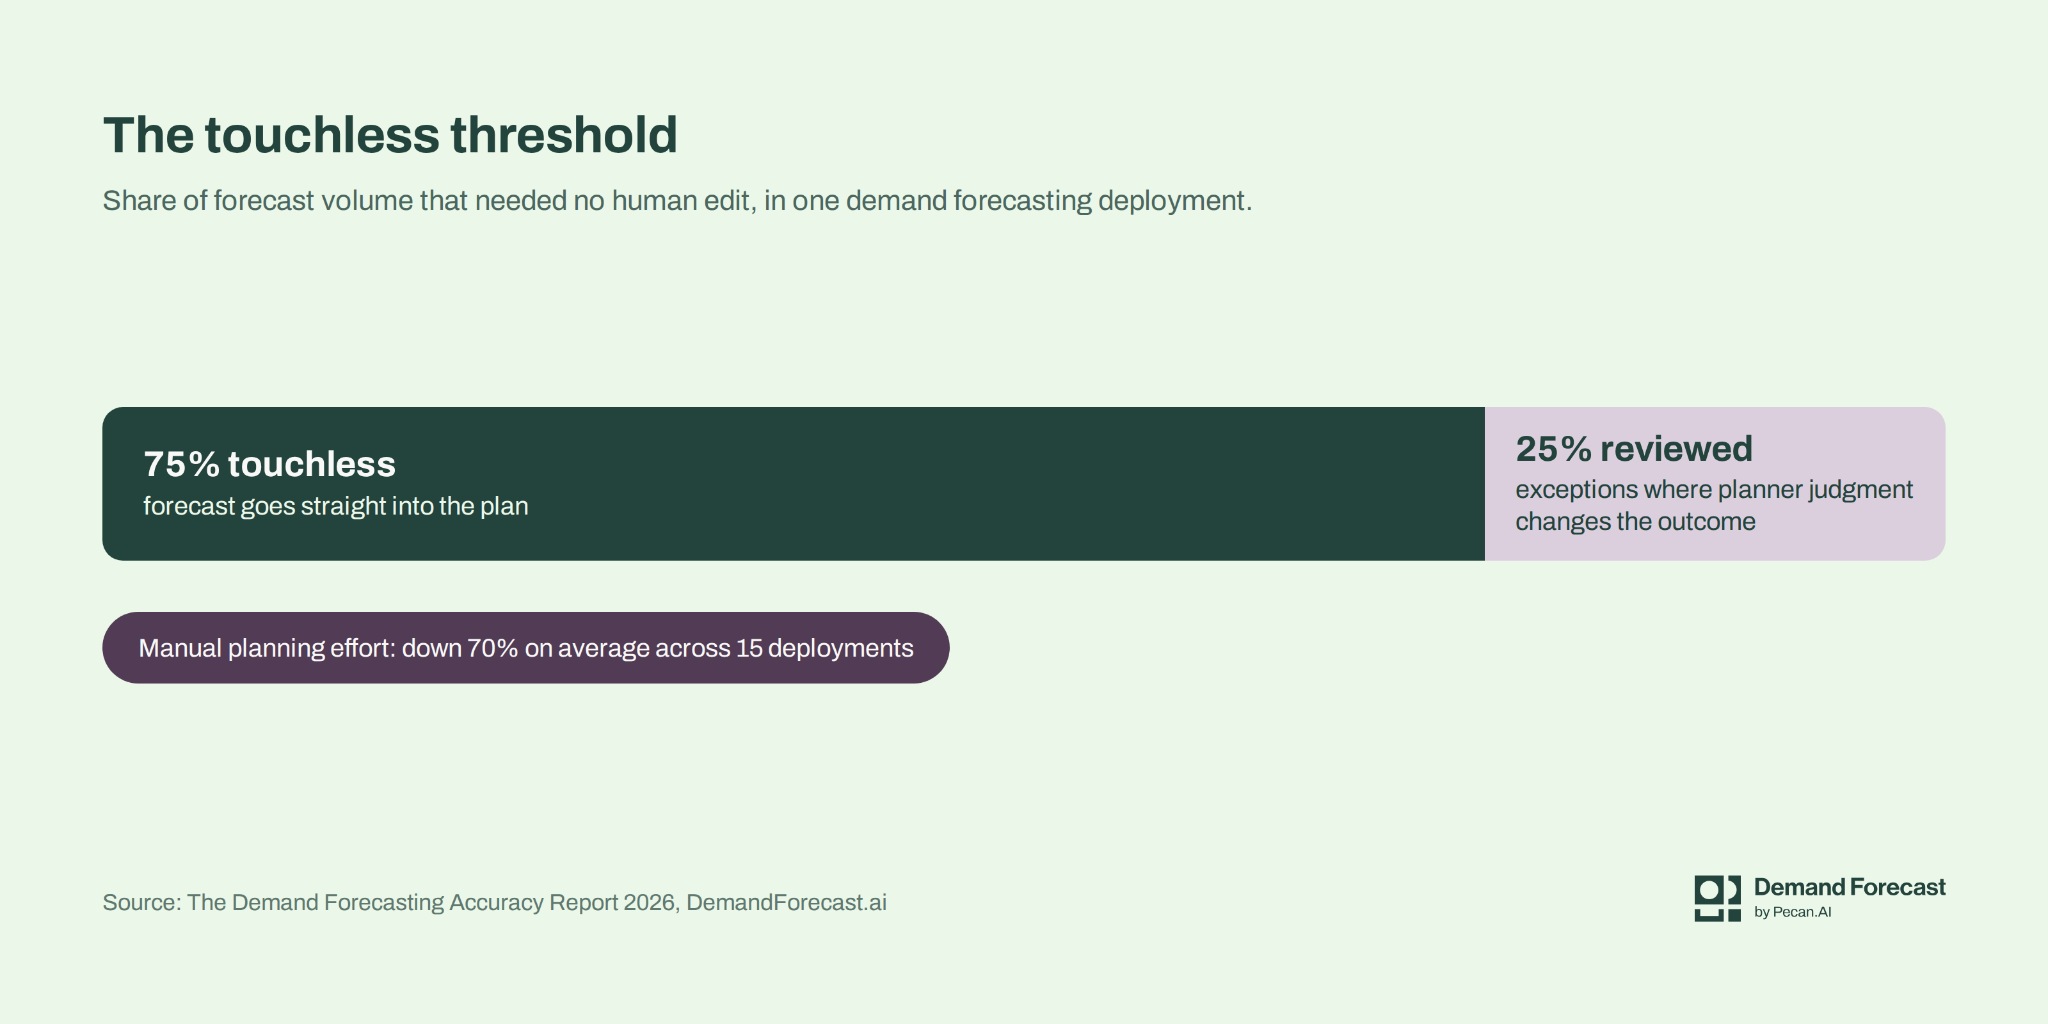
Manual planning effort fell by 70% on average across the 15 deployments. At Dorman, across more than 100,000 SKUs, manual data cleansing alone dropped by about 70%: the work of preparing history before any forecast can run. At Mars, 75% of forecast volume qualified as touchless: forecasts that can go into the plan without a planner's edit, leaving planners to review only the remaining quarter, the items where their judgment changes the outcome. As Kristen Daihes, Mars's Vice President of Global Supply Chain, put it, the planning team "can already 'not touch' ~75% of the volume."
We call that second figure the touchless threshold. Once three-quarters of forecast volume can pass without a human edit, demand planning stops being a review of everything and becomes exception management. The planner's week changes shape. Hours move from touching every SKU to investigating the ones the model flags: new launches, promotions, accounts with a known change coming.
Outside product demand, the pattern holds. CAA Club Group, Canada's largest automobile club, had been building roadside call volume forecasts by hand, a full week of work per set. Hourly forecasts across nearly 600 micro-regions and five service types now refresh twice a week, daily during winter storms, and run staffing and dispatch at every club facility. Time spent generating forecasts fell 30%, with no data science headcount added.
Ask any planner what they would do with 70% of their forecast prep time back. The answer is rarely "review more SKUs."
The answer is rarely ‘review more SKUs.’
Two ways to spend a planning week
Reviewing everything
- Every SKU gets a planner's edit, every cycle.
- The same fixes to the same SKUs, month after month.
- Hours go to cleaning history before a forecast can run.
Managing exceptions
- 75% of forecast volume goes straight into the plan.
- Planners review the quarter where their judgment changes the outcome.
- Manual data cleansing down about 70% in a 100,000-SKU deployment.
4. Portfolio complexity and forecast horizon
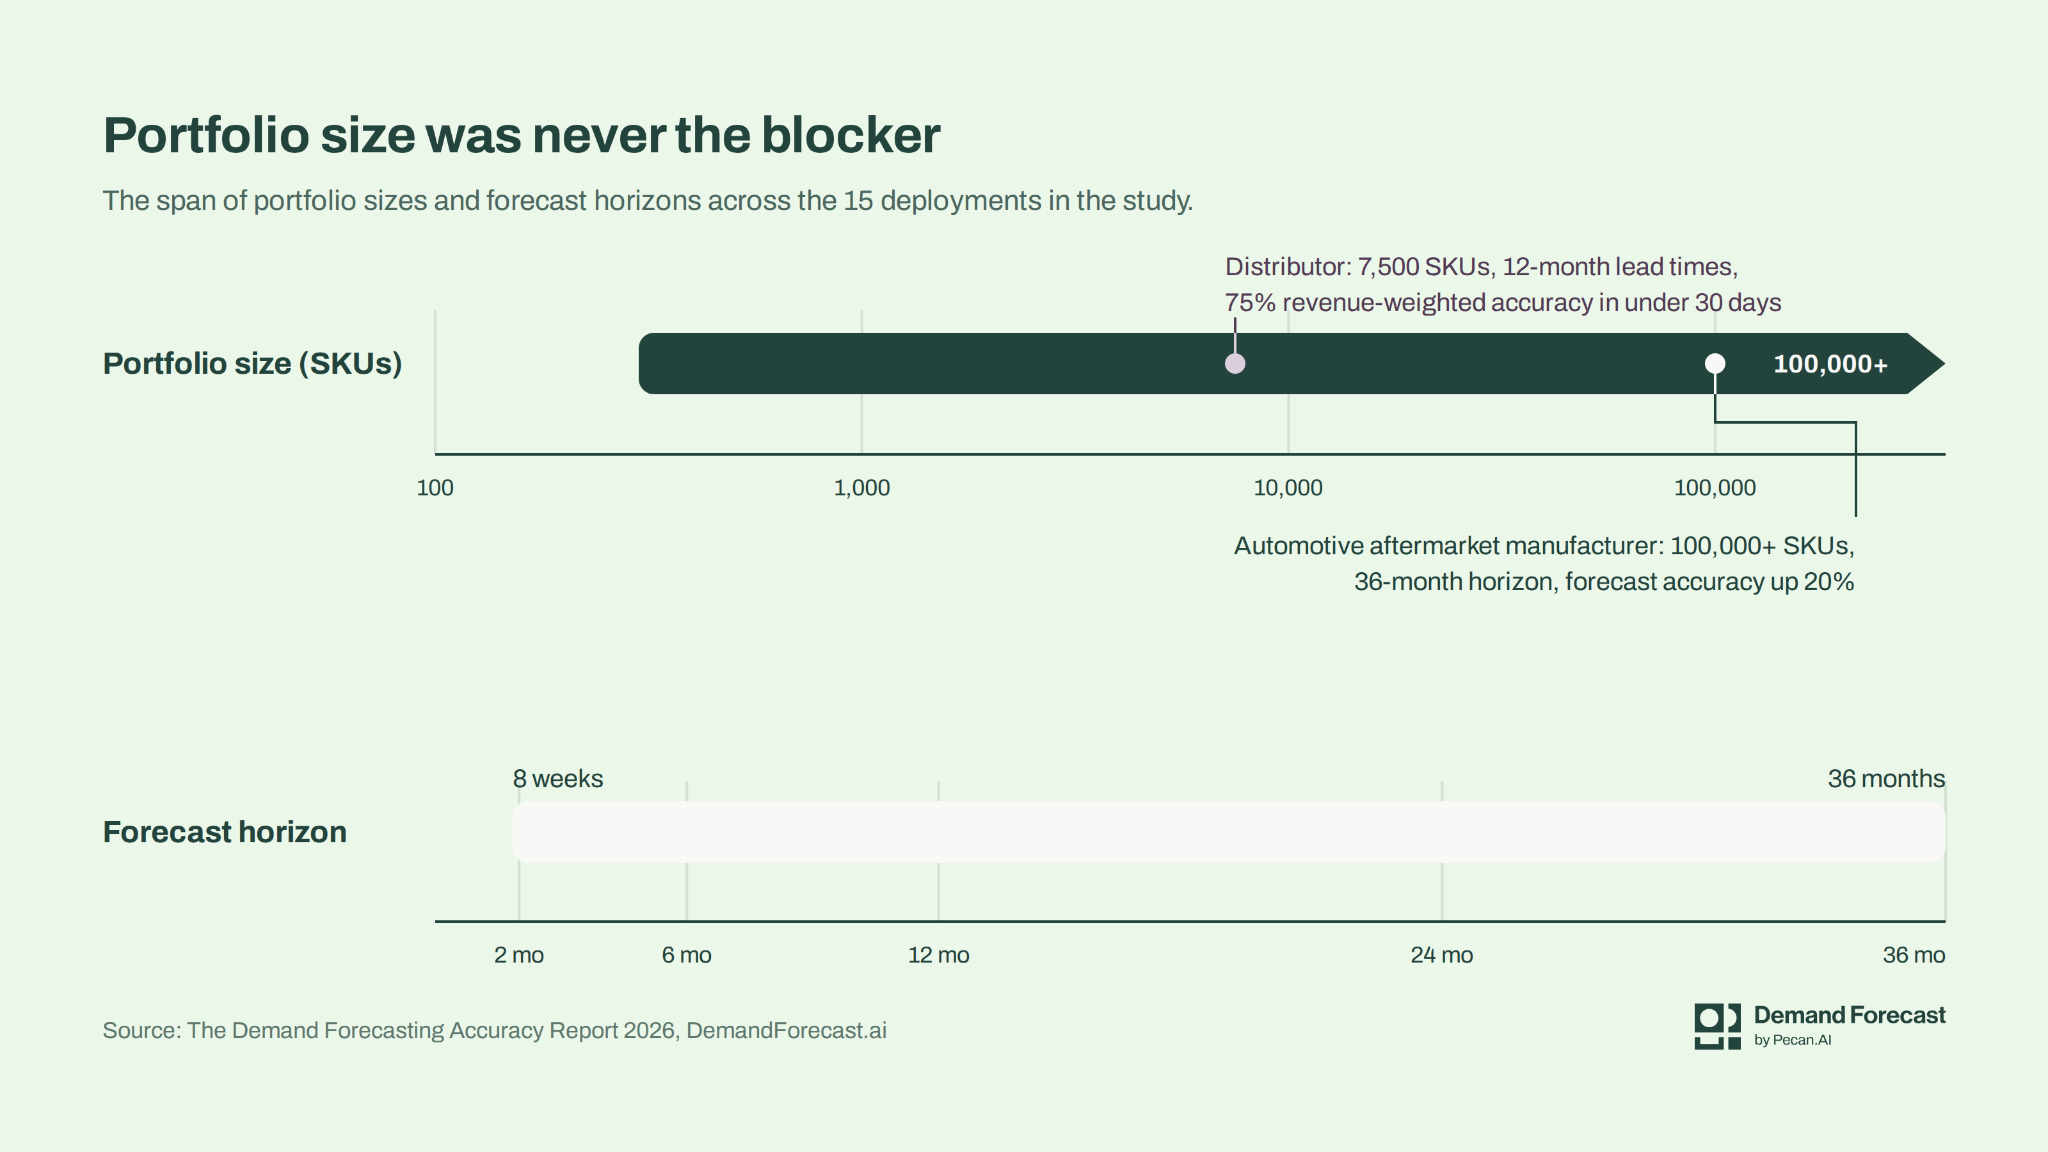
A common objection to AI forecasting is that it performs on tidy, high-volume portfolios and falls over on the long tail. The deployments in this study ran on portfolios from a few hundred SKUs to more than 100,000, with forecast horizons from 8 weeks to 36 months. Complexity was never the blocker.
Sitting at the far end of both ranges is Dorman, an automotive aftermarket manufacturer forecasting more than 100,000 SKUs on a 36-month horizon, with frequent product introductions and end-of-life items, where traditional forecasting methods struggle. It reduced weighted MAPE by 15% to 20% against its prior process and cut manual data cleanup by 70%, on the largest portfolio and the longest horizon in the study, with point-of-sale and store-level signals feeding forecasts connected directly to its SAP planning workflows. The grocery delivery platform forecast demand at SKU level across 26 cities and 12,000 partner stores, enriched with weather, traffic, and economic data, and reached 80% to 90% accuracy on its top revenue categories with a model built in days rather than months.
Consider the electrical components distributor in the study with 7,500 stocked SKUs, about 500 new products a year, and supplier lead times of up to 12 months. Long lead times punish forecast error twice. An order placed today against a bad forecast becomes overstock or a stockout a year from now, and there is nothing to be done about it in between. Its existing forecasts ran at about 60% accuracy on top-selling products. Within 30 days it reached 75% revenue-weighted accuracy. Accuracy by horizon, by product segment, ran from 58% to 73% one month out and 34% to 53% twelve months out, the decay any forecast shows as the horizon stretches toward a year.
Frontier Dental, a North American distributor supplying clinics across the U.S. and Canada, forecasts daily demand for thousands of SKUs across multiple warehouses, 60 days ahead. That gives procurement a 60-day window it did not have, at about 90% forecast accuracy on key SKUs, and the same models score which customers are likely to order, so the sales team reaches out before the order comes in.
5. What actually drives demand
Of all the findings here, this is the one we expect to be quoted most, because it contradicts what most planning teams believe about their own business.
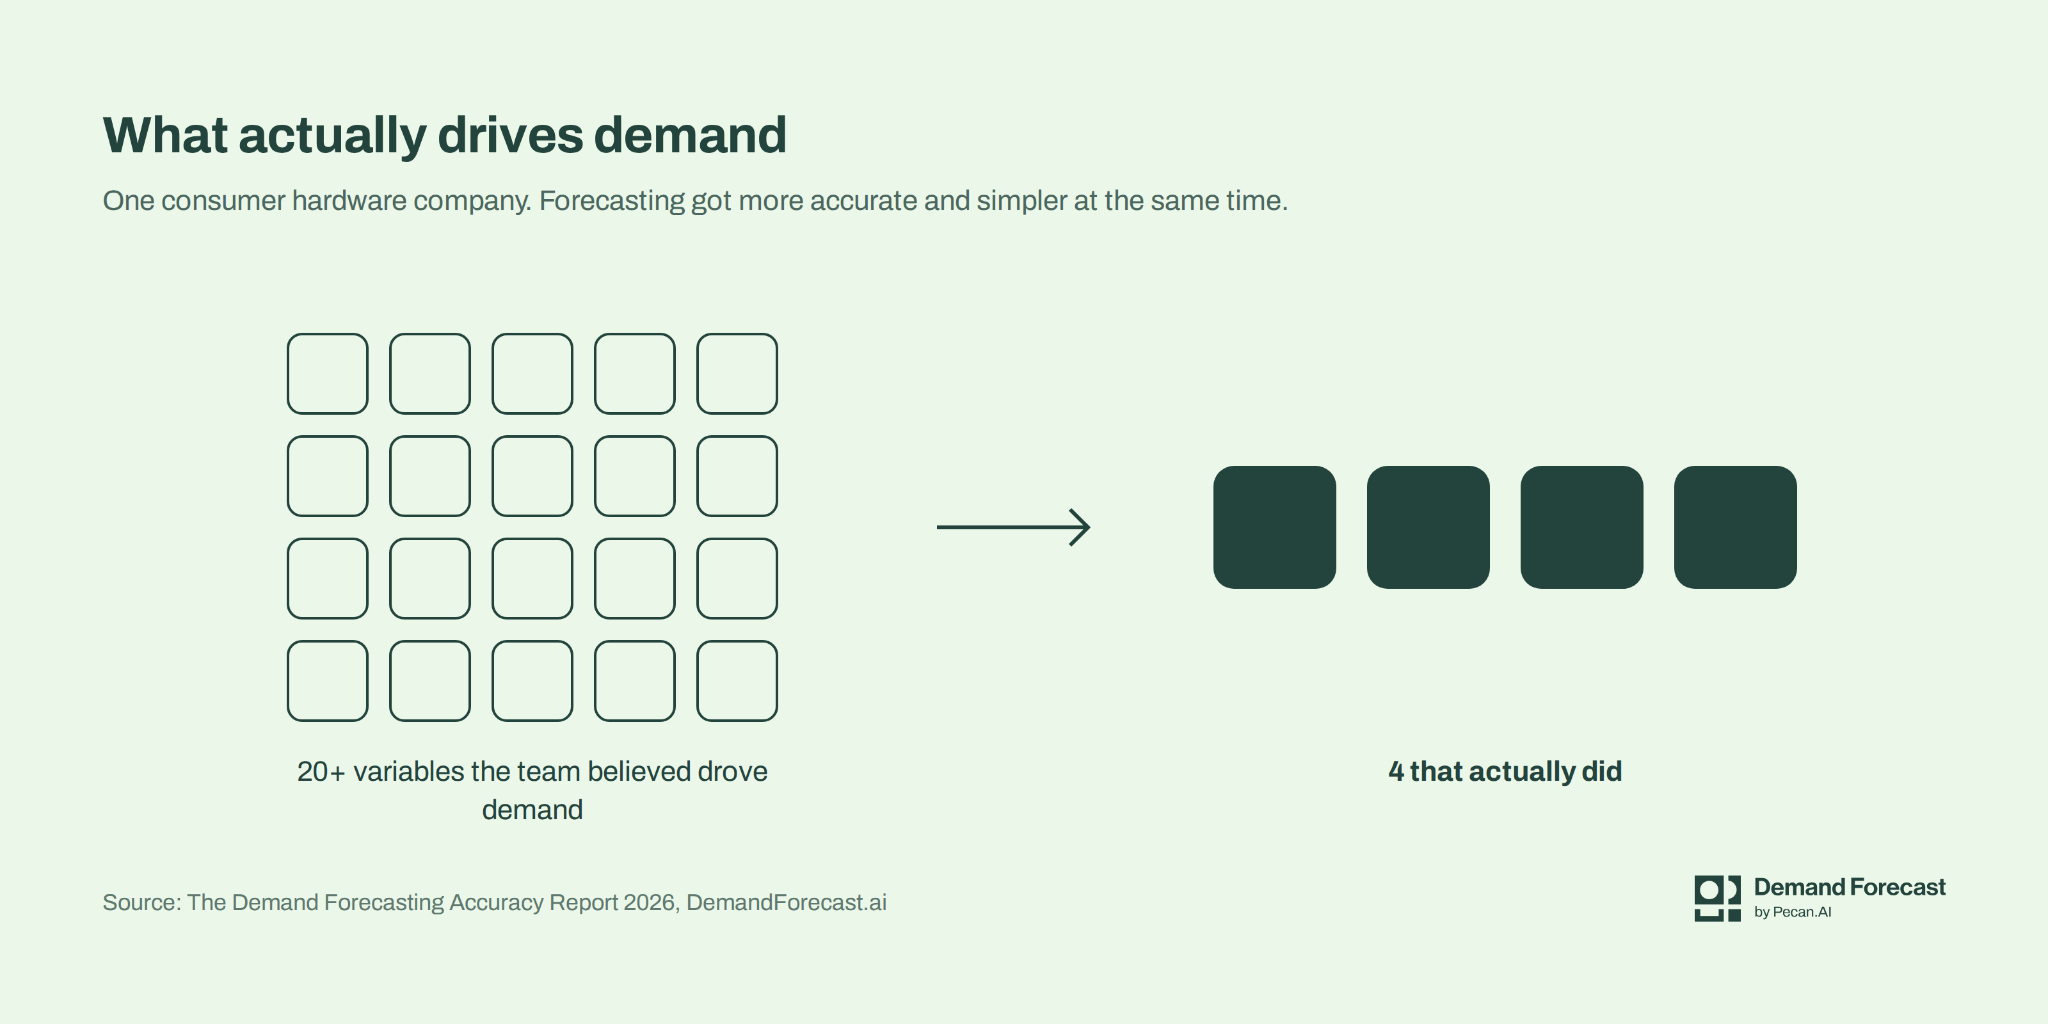
Nanit, a maker of smart baby monitors, began its project with more than 20 variables its team was confident drove demand. The model narrowed them to the four that carried predictive signal. Forecasting got more accurate and simpler at the same time: 80% forecast accuracy across SKUs and channels, from a company that had been running homegrown models in Python and Excel.
Which four matters less than the pattern. They were specific to that business, and anyone who copied them would be forecasting someone else's demand. The pattern is the transferable part. Many of the drivers a planning team tracks are correlated with each other, or with a demand history that already contains their effect, so they add noise rather than signal. A model that tests every candidate against held-out demand can say which ones earn their place. A planner working from experience can only say which ones feel important.
In practice, the consequence shows up in two places. Teams stop sourcing and maintaining data feeds for variables that don't move the forecast. And the forecast becomes easier to explain to the people who have to trust it, because four drivers fit on one slide.
“We improved forecast accuracy in our seasonal business, and we have a deeper understanding of the variables that may influence a consumer demand signal.”
6. Speed to first forecast: the four-week rule
Timelines in the study were measured in weeks, and in some cases days.
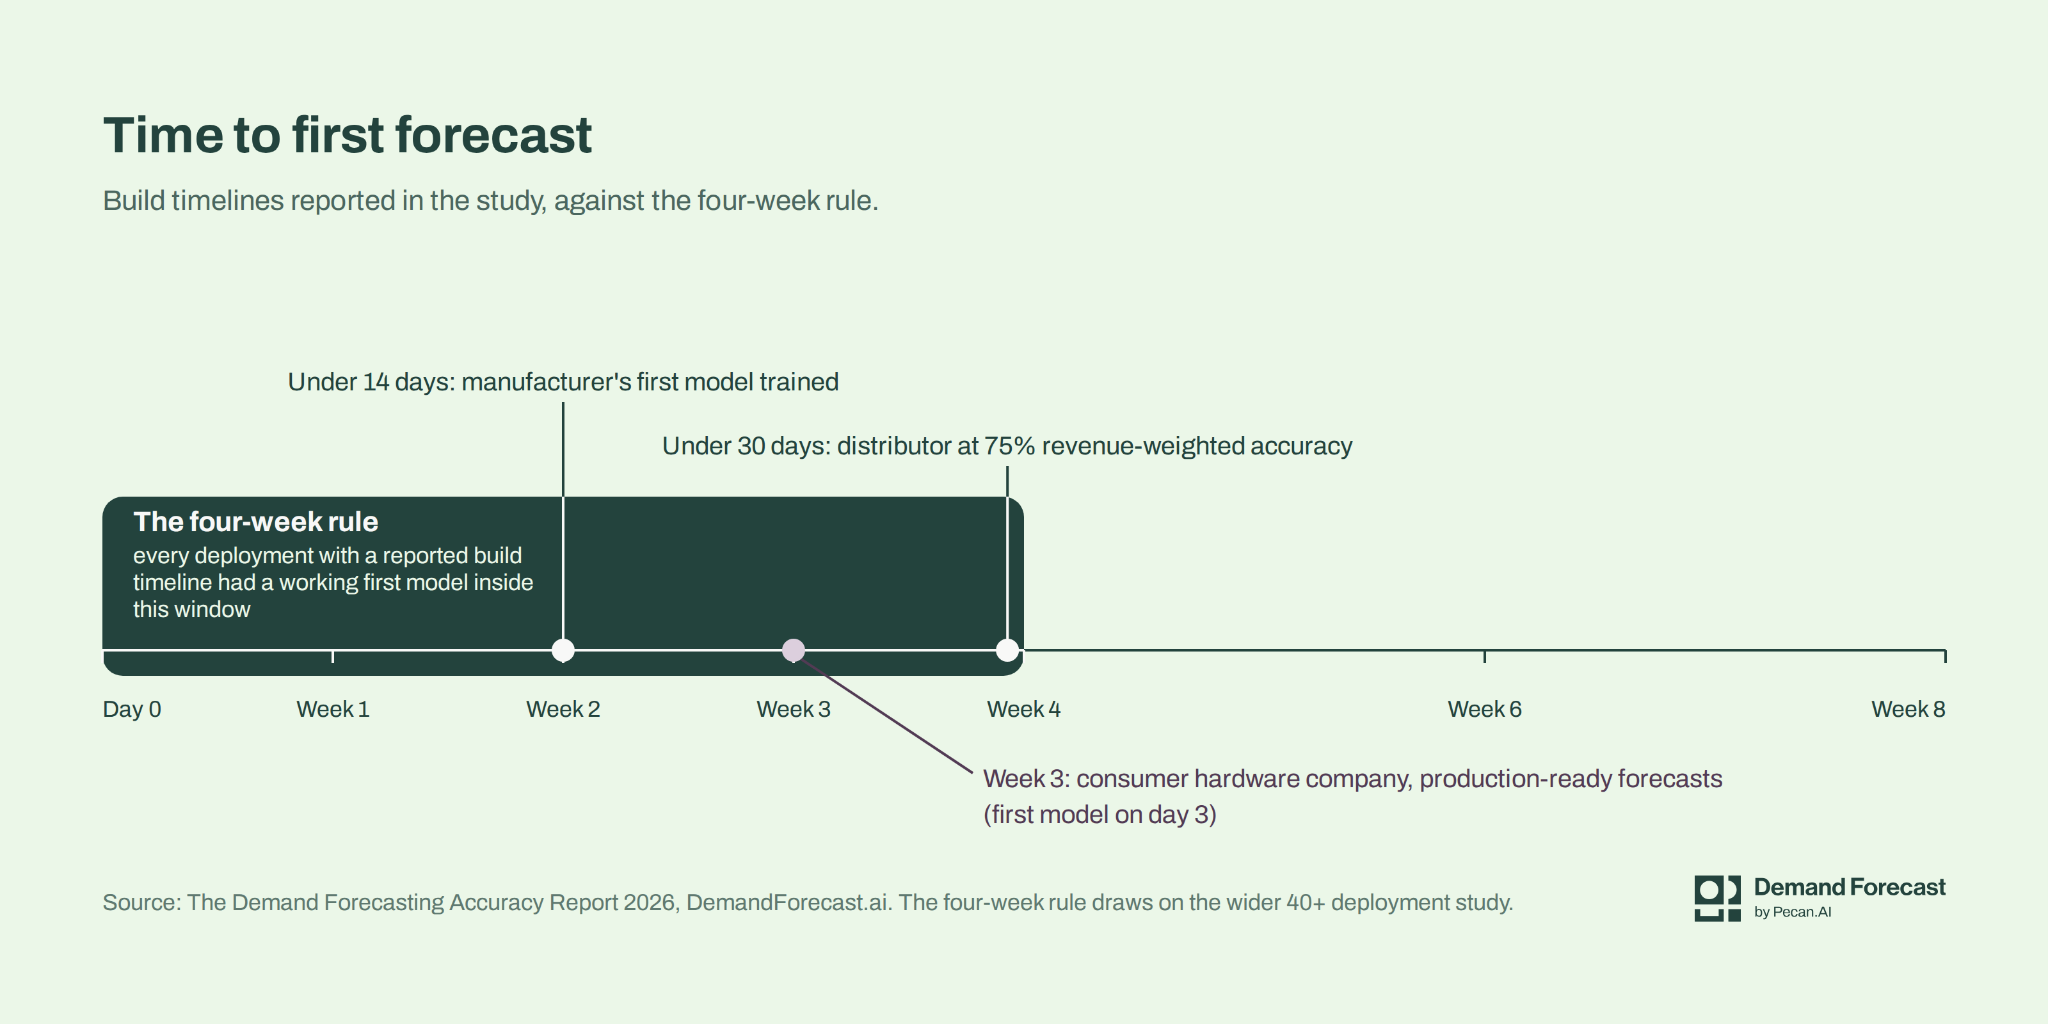
Start with the manufacturer that reported 15% labor and 25% inventory cost savings: its first model was trained in under 14 days. Nanit had its first model in three days and production-ready forecasts in three weeks, against the eight weeks a typical build would have taken. The 7,500-SKU distributor reached 75% revenue-weighted accuracy in under 30 days. Dorman reported forecasts that surpassed its prior process within a month. Kenvue's 37% MAPE reduction is a first-year figure, measured against the forecast it replaced.
These deployments belong to a wider study of more than 40 predictive deployments across use cases, forecasting included. In that wider set, every deployment that reported a build timeline had a working first model within four weeks. The fastest took days. The slowest took four weeks. Nobody took longer. We call it the four-week rule, and the demand forecasting deployments sat inside it with room to spare.
Production go-live is a separate clock. In the wider study, every deployment that reported a production date was live within eight weeks, and the median was about a month. Nucor's production model went live in under eight weeks.
“Pecan proved value quickly. Within a month, forecasts surpassed our prior process without manual cleanup, letting planners focus on strategy, not firefighting.”
Where this leaves the incumbent forecast
Companies rarely go looking for a forecasting model. They go looking for a forecast they can run the business on, usually after a period of making purchasing, production, and safety stock decisions against a number the planning team had quietly stopped trusting. The benchmark is how you find out whether that distrust is justified, and by how much.
Running one is a small project. It takes two to three years of SKU-level order or shipment history, the incumbent forecast for the same periods, and an agreed error metric. Every accuracy figure in this study came from one, and every one showed the same direction of result. The cost of not running it is another planning cycle spent making the same manual fixes to a forecast that has never been tested against an alternative.
Next year's edition will add the deployments benchmarked over the coming year. If your team runs its own comparison, we would like to see the result, whichever way it goes.
What a benchmark takes
That's the whole list.
- Two to three years of SKU-level order or shipment history
- The incumbent forecast for the same periods
- An agreed error metric: MAPE, weighted MAPE, or the one your team already reports
Limitations
Read the numbers with these in mind.
- All of it is customer deployment data. The set includes deployments that reached a benchmark and reported the result. Pilots that stalled before a benchmark, and companies that chose not to share outcomes, are not in it. That is why ranges are shown throughout and why no headline claims 100%. The sample is real, and it is not random.
- Metrics are the customer's own, in definition and in calculation. MAPE, weighted MAPE, and revenue-weighted accuracy are not interchangeable, and we have not restated any result in a metric the customer did not use. Cross-row comparisons are directional.
- Averages are calculated across the 15 demand forecasting deployments.
- Inventory, labor, and cost outcomes depend on decisions the customer made in response to the forecast. They are reported as observed and are not attributed to forecast accuracy alone.
- Build timelines behind the four-week rule were reported across the full 40+ deployment study, not the forecasting subset on its own. The forecasting timelines cited in section 6 fall within it.
- Customer names are withheld where the customer requested it. Industry descriptors are accurate to the deployment.
Frequently asked questions
Where does the data come from?
Every number on this page is a measured outcome from a live deployment. Findings are drawn from 15 demand forecasting deployments, plus supporting operations and inventory results, within a larger study of more than 40 deployments on Pecan's predictive engine between 2022 and 2026. DemandForecast.ai compiled and published the forecasting results; the underlying deployment data was validated by the team that ran each deployment. Nobody was surveyed.
Why compare against the incumbent forecast instead of reporting accuracy?
Absolute accuracy figures travel badly. Product mix, demand intermittency, and the level you forecast at (SKU, SKU-location, category) all move the number before the forecasting method has any influence on it. The benchmark that holds up is improvement over the forecast a company already runs, on that company's own data and in that company's own metric.
Why are customer names withheld?
Customer names are withheld where the customer requested it. Industry descriptors are accurate to the deployment.
Were any results left out?
The set includes deployments that reached a benchmark and reported the result. Pilots that stalled before a benchmark, and companies that chose not to share outcomes, are not in it. That is why ranges are shown throughout and why no headline claims 100%. The sample is real, and it is not random.
Can I use the charts in my own work?
Charts and the benchmark table may be reproduced with attribution to DemandForecast.ai and a link to this page.
What do we need to run the benchmark on our own data?
Running one is a small project. It takes two to three years of SKU-level order or shipment history, the incumbent forecast for the same periods, and an agreed error metric.
Is our data secure?
Your data stays encrypted and compartmentalized throughout.
About this study
Findings are drawn from 15 demand forecasting deployments, plus supporting operations and inventory results, within a larger study of more than 40 deployments on Pecan's predictive engine between 2022 and 2026. Accuracy results are head-to-head benchmarks against the customer's prior forecasting method, measured in the customer's own error metric. DemandForecast.ai compiled and published the forecasting results; the underlying deployment data was validated by the team that ran each deployment.
Cite this report
DemandForecast.ai (2026). The Demand Forecasting Accuracy Report 2026: What Happens When AI Forecasts Compete Against Incumbents. https://demandforecast.ai/research/forecast-accuracy-report
Charts and the benchmark table may be reproduced with attribution to DemandForecast.ai and a link to this page.